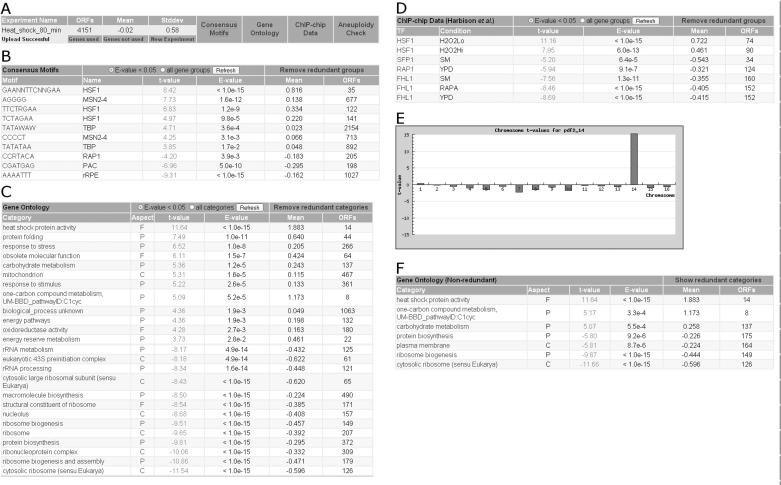
Figure 1.
Screenshots of the various T-profiler analysis results. (A) Statistics of the uploaded gene expression dataset for cells assayed 80 min after the temperature shift from 30 to 37°C (23). The type of analysis can be selected from the panels to the right. (B) Scoring consensus motifs. Only significantly scoring motifs are shown (E-value < 0.05). By selecting the motifs in the left column, information about the genes containing this motif and their expression levels can be obtained. (C) Scoring GO categories. Only a subset of the 50 significantly changed categories is shown. (D) Scoring ChIP-chip based gene groups. (E) Graph showing the t-value for each chromosome, obtained from the gene expression profile of the mutant pfd2Δ, in which chromosome 14 is duplicated. (F) The same result as in (C), but now with redundant gene groups removed by our iterative procedure.

