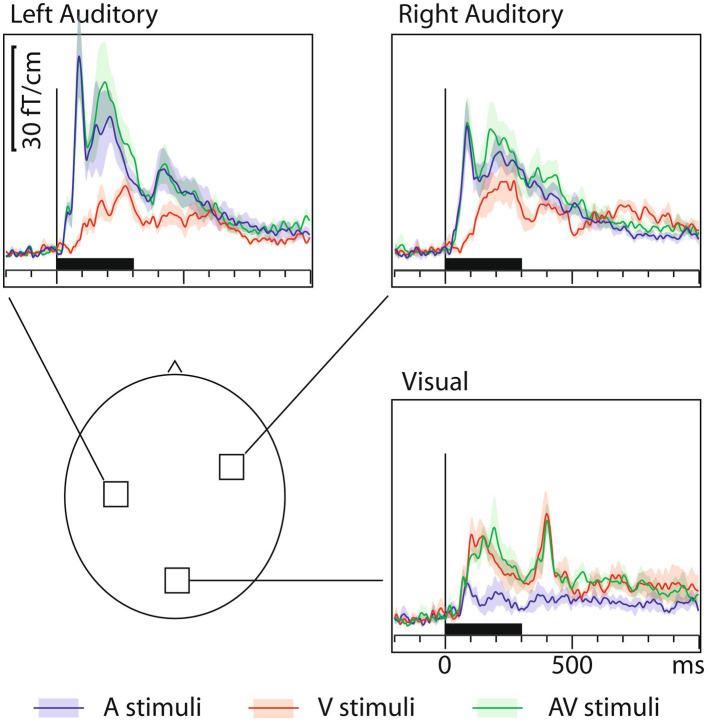
Figure 1.
MEG grand average sensor response (gradient amplitude) time courses with across-subjects means (lines) and their standard error of the mean (SEM) error bars (shaded areas around the mean curves) over the auditory and visual cortices for auditory (blue traces), visual (red traces), and audiovisual (green traces) letters. The approximate sensor locations are shown in the lower left panel. The corresponding onset latency numerical values are listed in Table 1. To generate these grand average waveforms (N=7), from each subject, the sensor location showing the maximal ~100 ms sensory-specific response was selected, and the signals from these sensors were averaged across subjects. Sensors over both auditory and visual cortices show cross-sensory activations, but these are stronger over the auditory than the visual cortex. The sensory-specific activations occur earlier than the cross-sensory activations. Time scales –200 to +1000 ms post stimulus, stimulus duration 300 ms (black bar).

