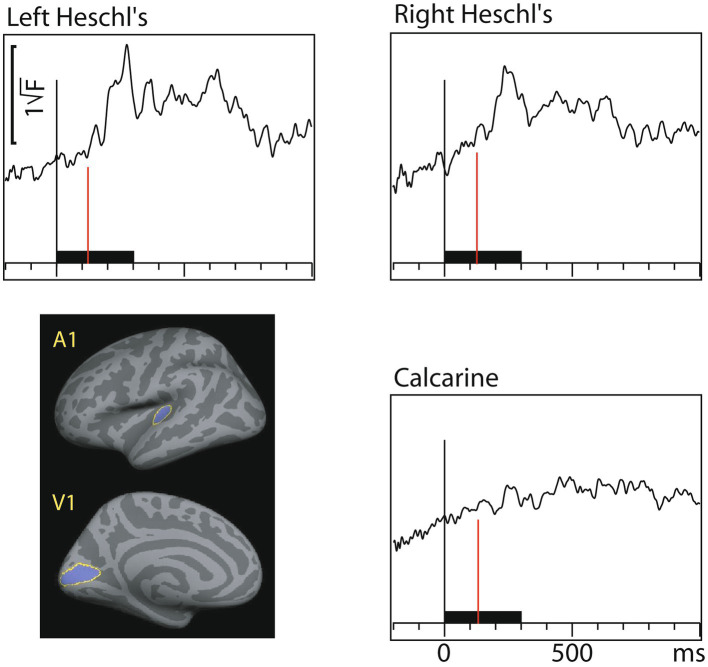
Figure 4.
Audiovisual interaction [AV– (A+V)] time courses (MEG source-specific dSPM) from Heschl’s gyri (A1) and calcarine fissure (V1); the onset latencies are reported in Table 3 (with bootstrapping, left and right A1 averaged). Interactions are observed in both the auditory and visual cortices. Time scales –200 to +1000 ms post stimulus, stimulus duration 300 ms (black bar). Grand average data (N=7).

