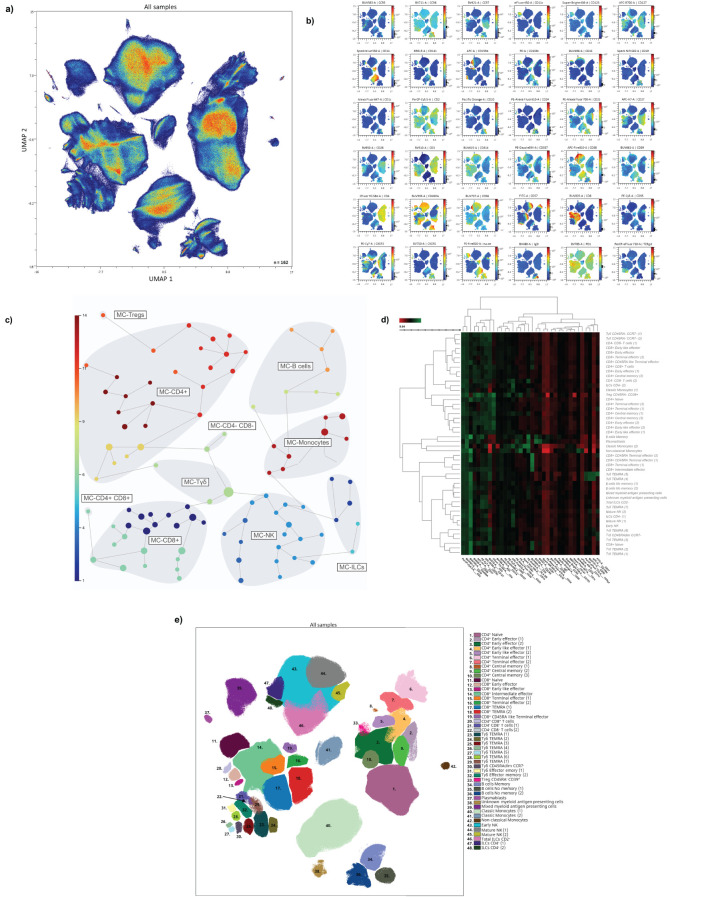
Figure 1.
Immunome characterisation following UMAP analysis. (A) UMAP analysis was performed within total singlet viable CD45+ cells from all samples (n = 162). Subsequent down-sampling to a total of 4 × 10⁶ events was performed so that each cohort was equally represented. Surface expression intensities of the remaining 36 analysed markers are shown in (B). The colour code is based on the intensity, where red represents higher expression and blue represents lower expression. (C) FlowSOM analysis of total singlet viable CD45+ cells identified the main metaclusters of the dataset: B-cells, NK cells, ILCs, Tγδ cells, Tregs, CD4+ T-cells, CD8+ T-cells, CD4+CD8+ T-cells and CD4–CD8– T-cells. (D) Heatmap displaying the intensity levels of each marker within the 48 identified clusters. The colour code is based on the expression intensity, where green represents higher expression and the transition to red represents lower expression. A dendrogram was generated by unsupervised hierarchical clustering. (E) All 48 identified clusters were overlaid on the UMAP projection (n = 162). Each identified cluster is tagged with a specific colour and number as shown in the legend.

