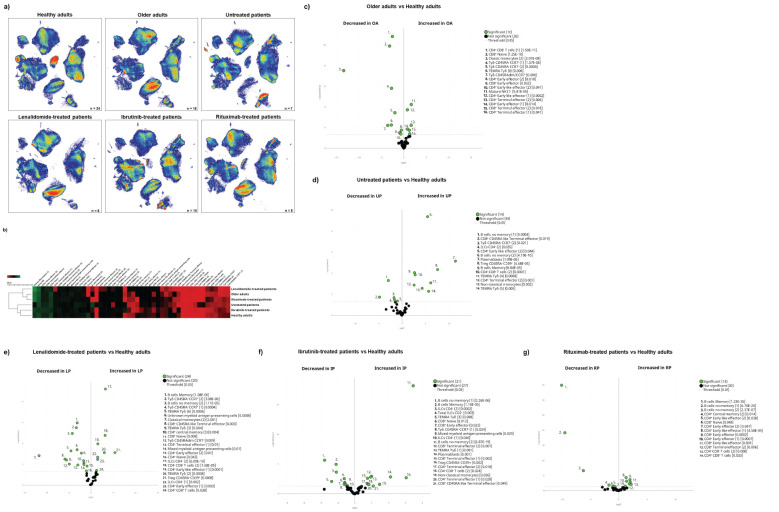
Figure 2.
Cohort differences before vaccination. (A) The general UMAP plot displays the cohort distribution before vaccination, including healthy adults (n = 24), older adults (n = 18), untreated oncohaematologic patients (n = 7), lenalidomide-treated oncohaematologic patients (n = 8), ibrutinib-treated oncohaematologic patients (n = 14) and rituximab-treated oncohaematologic patients (n = 8). (B) The heatmap displays the intensity levels of each of the 48 identified clusters within the cohorts. The colour code is based on the expression intensity, where green represents higher expression and the transition to red represents lower expression. The dendrogram was generated by unsupervised hierarchical clustering. Volcano plots comparing the clusters identified in Table 1 and Figure 1 between healthy adults (n = 24) and (C) older adults (n = 18), (D) untreated patients (n = 7), (E) lenalidomide-treated oncohaematologic patients (n = 8), (F) ibrutinib-treated oncohaematologic patients (n = 14) and (G) rituximab-treated oncohaematologic patients (n = 8). The colour code is based on the expression intensity, where red represents higher expression and the transition to green represents lower expression. For the volcano plots, differentially expressed clusters (p < 0.05) in the comparisons are highlighted in green. Due to the low number of events, some clusters could not be analysed in (C) (CD45RA – CD39 + Tregs, non-classical monocytes, plasmablasts, CD4–CD8– T-cells [2], TEMRA Tγδ cells [4] and TEMRA Tγδ cells [5]), (D) (non-classical monocytes, plasmablasts, TEMRA Tγδ cells [4] and TEMRA Tγδ cells [5]) and (G) (Tregs CD45RA –/ CD39 + , non-classical monocytes, plasmablasts and TEMRA Tγδ cells [4]).

