Figure 6.
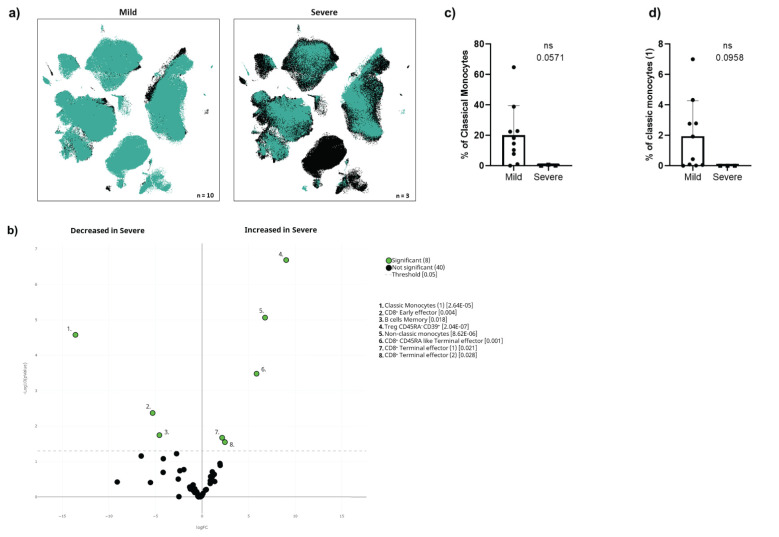
Cellular immunome before vaccination predicts COVID-19-induced hospitalisation. (A) UMAP plot of pre-vaccination samples of infected oncohaematologic patients according to the COVID-19 outcome defined as mild (left, no need for hospitalisation, n = 10) or severe (right, hospitalisation required, n = 3). (B) Volcano plot analysis comparing the clusters identified in Table 1 and Figure 1 for the infected oncohaematologic patients based on the COVID-19 outcome. (C) Classical validation, following the gating strategy shown in Supplementary Figure S1 , of total monocytes, and (D) the classic monocyte (1) cluster. In (B), green dots represent those clusters that showed significant differences (p < 0.05). A one-tailed t-test was applied for (C) and (D); the p-values are shown in the figures (ns, not statistically significant).

