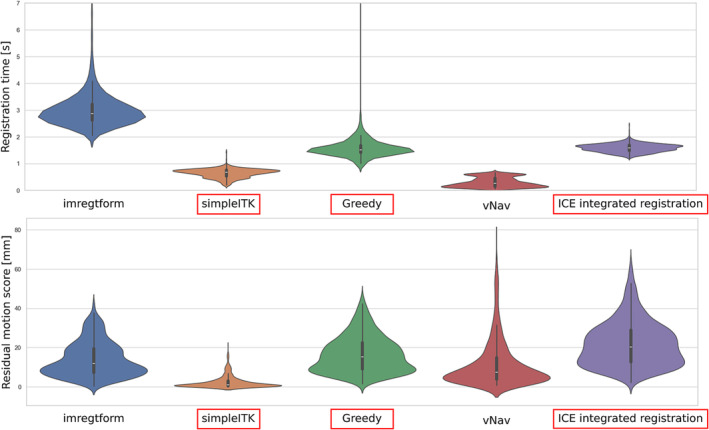
FIGURE 4.

Comparison of speed and accuracy for registration methods on synthetic data comprising 330 3D FatNav image pairs. Full details are given in the methods section. Violin plots of (A) registration time, (B) residual motion score after registration. Smaller motion scores mean that the registration has come closer to the ground truth, i.e. smaller motion scores are better. SimpleITK, greedy and ICE integrated registration (marked with red boxes) were chosen for further assessment in vivo. White dot in the middle of each violin represents the mean value across 330 subjects.
