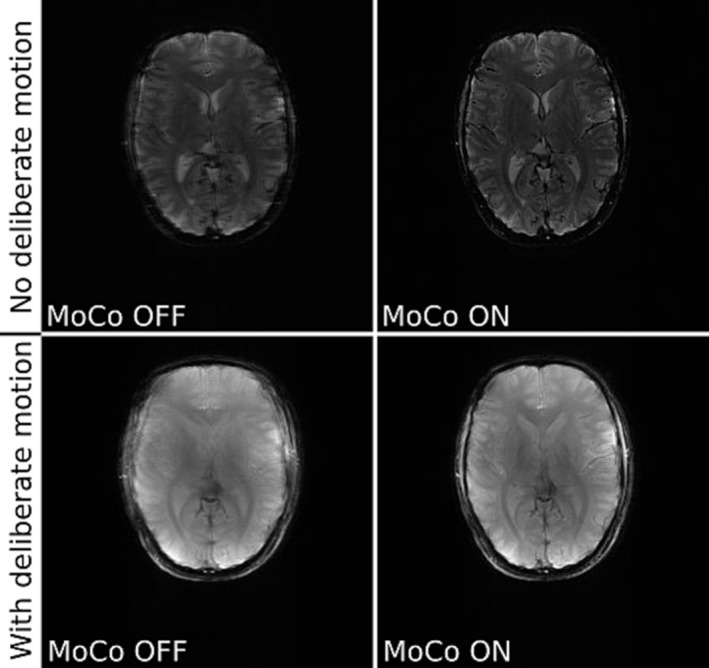
FIGURE 6.

Comparison of not corrected (MoCo OFF ‐ left) and corrected for motion (MoCo ON ‐ right) GRE images of a healthy volunteer (slice 4/10 – top row and 7/12 – bottom row). The top row shows T2* weighted images acquired without deliberate motion; the bottom row shows T1 weighted images of a volunteer making deliberate movements. Registration was performed with simpleITK. The images shown are sums of either even numbered (not corrected) or odd numbered (corrected) scans added to the first (reference) scan. Motion scores describing extent of movement were: 2.23 mm (top row), 6.55 mm (bottom row), the ratio of the variances of the image Laplacians for corrected vs uncorrected images was: 1.16 (top row), 1.42 (bottom row).
