
FIGURE 9.
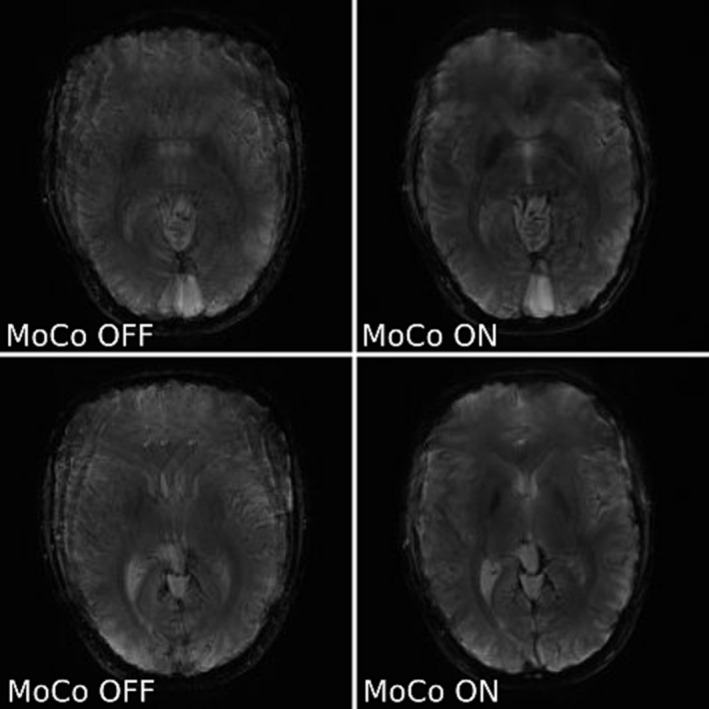
Comparison of two slices of not corrected (left) and corrected for motion (right) T2* weighted GRE images of a not immobilised healthy volunteer with deliberate motion (slice 4/10 – top row, and 6/10 – bottom row). These images used greedy registration. The images shown are sums of all measurements acquired either without (MoCo OFF ‐ left) or with motion correction (MoCo ON ‐ right). Motion scores describing extent of movement were: 5.07 mm (left, not corrected) and 7.97 mm (right, motion corrected). The ratio of the variance of the image Laplacian for corrected vs uncorrected was: 1.01 (top) and 1.07 (bottom).