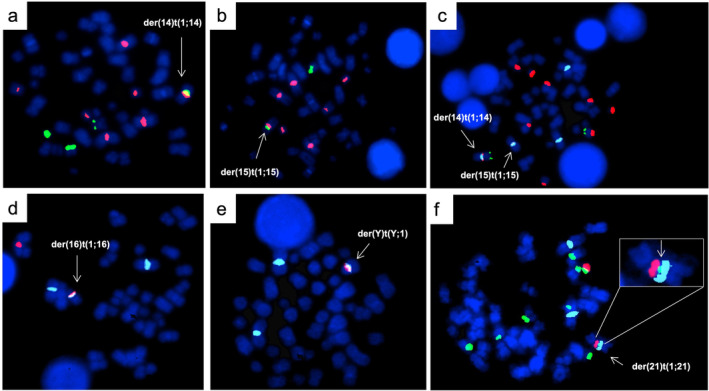
FIGURE 1.

FISH characterization of the three patients. Case 1 (a–c). Hybridization of the Sat.2 oligo probe for 1q12 sat‐II region (orange) and D14Z1 centromeric probe for chromosome 14 (green) (panel a); and D15Z3 centromeric probe for chromosome 15 (green) (panel b); tricolor FISH showing der(14) and der(15) in the same metaphase with pUC1.77 for 1q12 heterochromatin (aqua), RP5‐1174A5 probe for NORs (orange) in acrocentrics and RP11‐431B1 probe for 14q32 (green), used as a reference for chromosome 14 (panel c). Case 2 (d and e). Hybridization of Sat.2 oligo probe for 1q12 sat‐II region (aqua) and D16Z3 probe for pericentromeric heterochromatin of chromosome 16 (orange) (panel d); and DYZ1 probe for sat‐III of chromosome Y (orange) (panel e). Case 3 (f). Hybridization of pUC1.77 for 1q12 heterochromatin (aqua), RP5‐1174A5 probe for NORs (green) in acrocentrics and whole chromosome paint probe for chromosome 21 (orange). On the top right the insert showing a reduction of the signal for RP5‐1174A5 probe for NORs (green) in the der(21).
