
FIGURE 6.
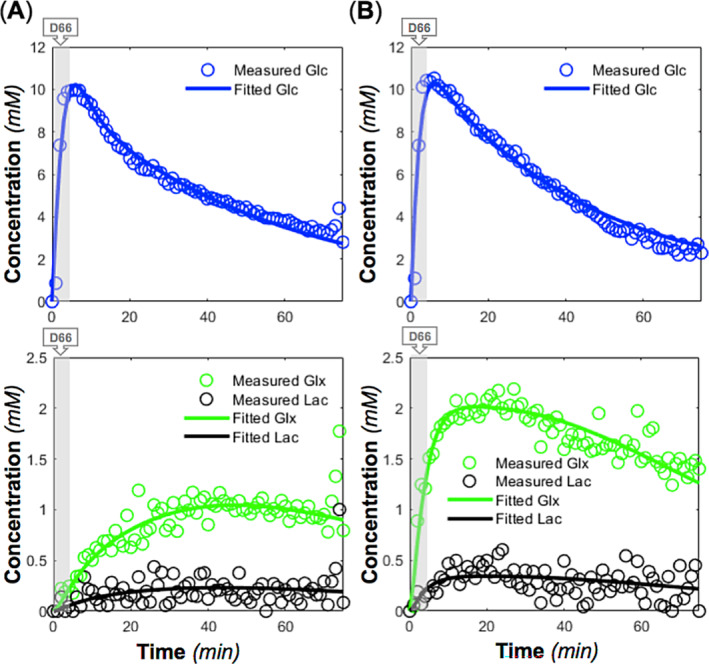
Time courses and model fittings of brain deuterated glucose (Glc), glutamate/glutamine (Glx), and lactate (lac) concentrations in two rats ((A) rat A and (B) rat B) during and after d‐glucose‐6,6‐d2 (D66) administration (indicated by shaded areas) using the modified kinetic model (Figure S2). The derived cerebral metabolic rate of glucose consumption (CMRGlc), cerebral metabolic rate of the tricarboxylic acid cycle (V TCA), and cerebral metabolic rate of lactate formation (CMRLac) values from the model fitting were 0.60, 1.16, and 0.05 μmol/g/min for rat A and 0.67, 1.17, and 0.17 μmol/g/min for rat B, respectively.