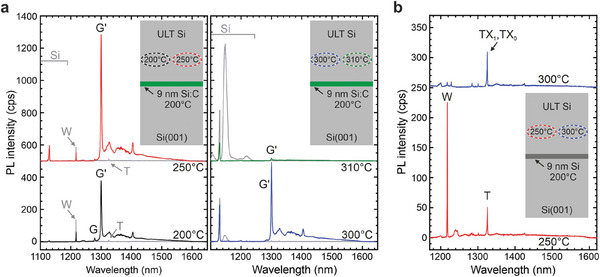
Figure 2.

Photoluminescence spectra of Si color centers formed within nanoconfined layers. a) Deposition of 9 nm Si:C at T G = 200 °C and overgrown with Si at T cap = 200 °C (black spectrum), T cap = 250 °C (red spectrum), T cap = 300 °C (blue spectrum), and T cap = 310 °C (green spectrum). Insets show the respective fabrication scheme. Grey PL spectra originate from pure Si reference samples, grown at the respective T caps of 200, 250, 300, and 310 °C. Predominant formation of G′ color centers in the 9 nm Si:C layer and W‐centers in the Si capping layer at T cap ≤ 250 °C. b) Predominant self‐assembly of W‐centers (red spectrum) and T‐centers (blue spectrum) through the growth of 9 nm Si at T G = 200 °C followed by Si overgrowth at T cap = 250 °C and T cap = 300 °C, respectively. Some spectra are vertically shifted for clarity.
