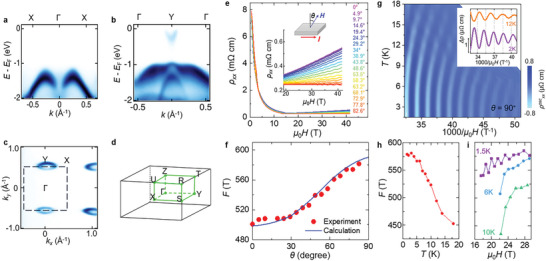
Figure 5.

Electronic structure of GdPS. a–d) Electronic structure at zero field. APRES observation of the electronic band dispersion at 90 K along a) Γ‐X and b) Γ‐Y directions. An electron band slightly crosses the E F at Y, leading to a small Fermi surface at Y point as shown in (c). d) Brillouin zone for GdPS. The black dotted square in c marks the surface Brillouin zone. e) Angular dependence for MR for in‐plane resistivity ρxx , measured by rotating field perpendicular to (θ‐dependence, left) and within (φ‐dependence, right) the phosphorus plane. Inset: schematic of magnetic field rotation. e–i) Electronic structure of the polarized FM state probed by quantum oscillations. e) High field MR at T = 0.5 K for GdPS, measured at various magnetic field orientations. Upper inset shows the measurement schematic. Lower inset shows the SdH oscillation at high field. f) Field‐angular dependence for SdH oscillation frequency obtained from data in (e) (see Figure S12, Supporting Information). The observed angular dependence matches well with the calculated Fermi surface formed from the exchange‐split Gd d‐band at Γ, assuming shifted E F by 0.245 eV (see Experimental Section). g) Contour plot showing the dependence of the SdH oscillatory component ρxx osc with temperature and inverse magnetic field, constructed from SdH effect at various temperatures shown in Figure S13a in Supporting Information. Inset: Oscillation pattern at 2 and 12 K. h) Temperature‐ and i) field‐dependence for SdH oscillation frequency of the same sample (see Experimental Section for extracting frequencies). Results in (e–i) are from the identical sample measured using e,f) a 41 T magnet and g–i) a 31 T magnet.
