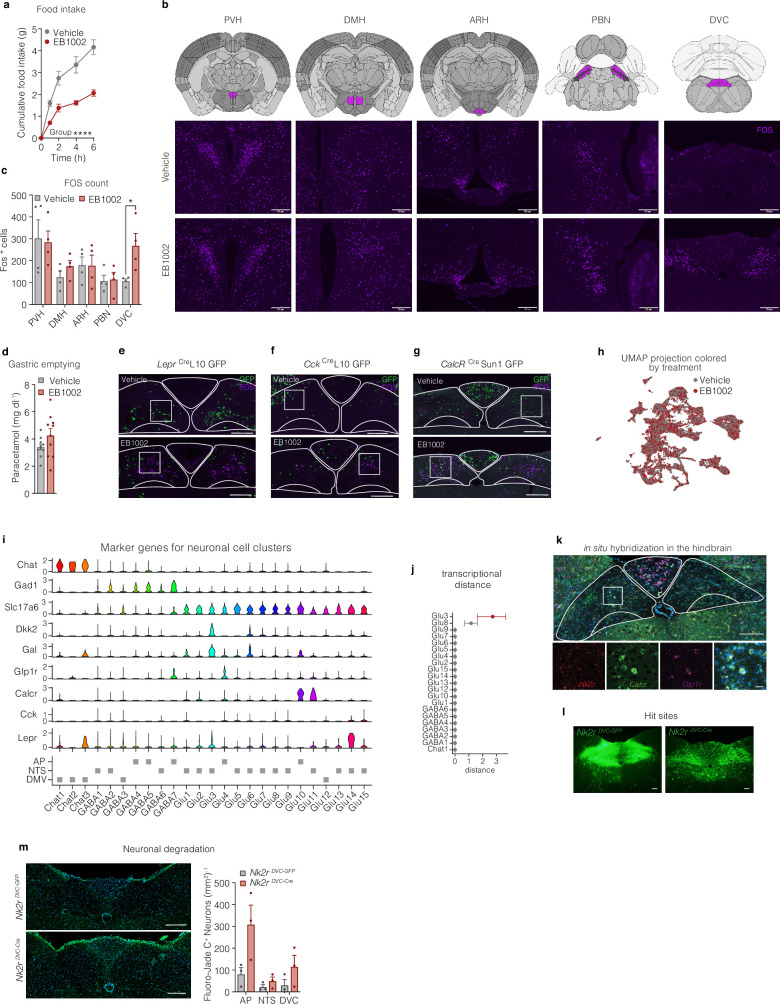
Extended Data Fig. 5. Central effects of NK2R agonism.
a, Food intake in over-night fasted mice that have been s.c. injected with vehicle or 325 nmol/kg EB1002 at time of refeeding (n = 10 mice per group). b, Schematics of brain sections (adopted from The Allen Brain Atlas) and representative images of FOS staining (purple) with c, quantification of FOS positive cells in the paraventricular nucleus of the hypothalamus (PVH), the dorsomedial hypothalamic nucleus (DMH), arcuate nucleus (ARH), the parabrachial nucleus (PBN) and the dorsal vagal complex (DVC) of overnight fasted mice injected with vehicle or 325 nmol/kg EB1002 2 h prior to euthanasia (n = 4 mice per group), scale bar 200 µm. d, Liquid phase gastric emptying of mice s.c. injected with vehicle or 325 nmol/kg EB1002 (n = 10 mice each group). Representative microscopy images and quantification of FOS (purple) colocalization with reporter neurons (green) in the DVC of e, LeprCreL10 GFP (n = 3 (vehicle), n = 6 (EB1002)), f, CckCreL10 GFP (n = 2 (vehicle), n = 3 (EB1002)), and, g, CalcrCre Sun1 GFP mice (n = 6 (vehicle), n = 7 (EB1002)) injected with vehicle or EB1002, scale bar 200 µm. h, UMAP plot of 23,664 neurons colored by treatment, i, violin plot, and j, transcriptional case-control analysis of single nuclei RNA sequencing data of the DVC of mice s.c. injected with vehicle or 325 nmol/kg EB1002 2 h prior to euthanasia (n = 6 samples with 5 mice/sample). k, in situ hybridization of Nk2r (red), Calcr (green) and Glp1r (purple) in the DVC, scale bar: top panel 200 µm, bottom panel 50 µm. l, Representative microscopy images of the hit sites, scale bar 200 µm. m, Representative microscopy images of Fluoro-Jade C stain in the DVC of Nk2r floxed mice that received a bilateral injection of AAV-GFP (Nk2rDVC-GFP) or AAV-Cre (Nk2rDVC-Cre) into the DVC, scale bar 200 µm, (n = 3 mice per group). Data are represented as mean ± s.e.m. For all: *P ≤ 0.05, **P < 0.01, ***P < 0.005, ****P < 0.0001. Repeated measures two-way ANOVA with Geisser-Greenhouse correction, significance indicates treatment effect, a; unpaired two-tailed t-test, c, d, m; for j red color indicates *P < 0.05.

