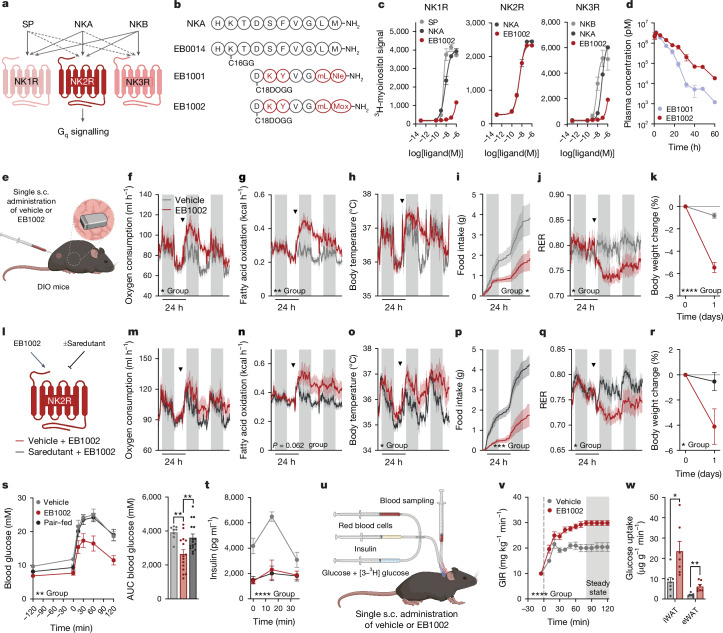
Fig. 2. Development and characterization of first-in-class selective, long-acting NK2R agonists.
a, Signalling schematic for the tachykinin receptor family along with respective endogenous ligands, substance P (SP), NKA and neurokinin B (NKB), adapted from ref. 6. b, Sequences of NKA and protracted, selective NK2R agonists. c, Ligand-induced Gq signalling of human tachykinin receptors in vitro (n = 2 per ligand). d, Pharmacokinetic profile of NK2R agonists (n = 3 mice per group). e–k, In vivo effects of a single injection of EB1002 (e; inset shows the implanted body temperature monitor) on oxygen consumption (f), fatty acid oxidation (g), body temperature (h), food intake (i), RER (j) and weight loss (k) in DIO mice. In f–j, arrowheads indicate time of injection of vehicle or EB1002. Plot colours in f–k match key in f. n = 6 (vehicle), n = 5 (EB1002) (f–i); n = 8 (vehicle), n = 9 (EB1002) (k). l–r, Evaluation of in vivo selectivity of EB1002 with or without pre-administration of the NK2R antagonist saredutant in DIO mice (l) on oxygen consumption (m), fatty acid oxidation (n), body temperature (o), food intake (p), RER (q) and weight loss (r). In m–q, arrowheads indicate 0.5 h pretreatment with vehicle or saredutant followed by EB1002. Plot colours in m–r match key below l. n = 6 per group (m,n,p–r); n = 5 per group (o). s,t, Glucose tolerance (s) and insulin level (t) of DIO mice (n = 8 (vehicle), n = 15 (325 nmol kg−1 EB1002), n = 16 (pair-fed with the EB1002-treated group)). u, Setup of the hyperinsulinaemic–euglycaemic clamp study. v,w, Glucose infusion rate (GIR) (v) and glucose uptake into iWAT and eWAT depots (w), for a hyperinsulinaemic–euglycaemic clamp of lean mice 16 h after a single injection of vehicle (n = 7) or EB1002 (n = 8). Data are mean ± s.e.m. *P < 0.05, **P < 0.01, ***P < 0.005, ****P < 0.0001. Detailed statistics are in the Supplementary Information and Source Data.

