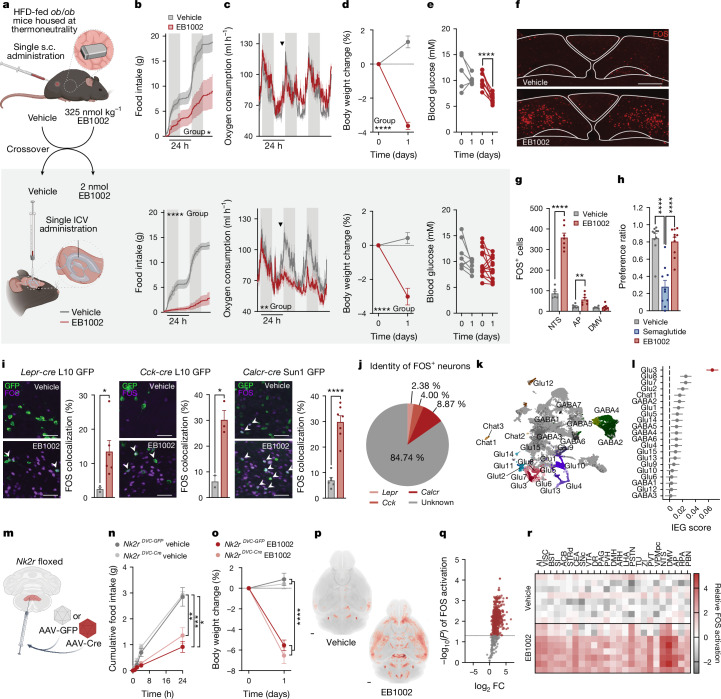
Fig. 4. Distinct central and peripheral actions of long-acting NK2R agonism.
a, Study design comparing effects of central and peripheral delivery of EB1002. b–e, Food intake (b), oxygen consumption (c), weight loss (d) and blood glucose concentration (e) following subcutaneous or ICV injection (all plot colours as in key in b). n = 6 (vehicle subcutaneous injections, EB1002 ICV injections), n = 4 (EB1002 subcutaneous injections, vehicle ICV injections) (b,c); n = 6 (vehicle subcutaneous injections), n = 10 (EB1002 subcutaneous injections), n = 8 (vehicle ICV injections), n = 13 (EB1002 ICV injections) (d,e). Arrowheads indicate injections (c). f,g, Representative FOS staining in the DVC (f; scale bar, 200 µm) and quantification of FOS-positive cells in the NTS, AP and DMV (g) of mice injected with vehicle (n = 6) or EB1002 (n = 8). h, Preference ratio for vehicle, semaglutide or EB1002 (n = 10 per group). i, Representative microscopy images and quantification of FOS colocalization with reporter neurons expressing GFP in the NTS of Leprcre L10 GFP (n = 3 (vehicle), n = 6 (EB1002)), Cckcre L10 GFP (n = 2 (vehicle), n = 3 (EB1002)) and Calcrcre Sun1 GFP mice (n = 6 (vehicle), n = 7 (EB1002)) injected with vehicle or EB1002. Scale bars, 50 µm. Plot colours as in key in b. j, Identity of FOS+ neurons in the NTS of EB1002-injected mice. k, Uniform manifold approximation and projection (UMAP) plot of expression data from 23,664 neurons coloured by populations according to ref. 39. l, Immediate early gene (IEG) expression in DVC snRNA-seq data from mice injected with vehicle or EB1002 (n = 6 samples with 5 mice per sample). m, Schematic of AAV injection into the DVC of Nk2r-floxed mice. n,o, Food intake (n) and weight loss (o) of Nk2rDVC-GFP and Nk2rDVC-cre mice injected with vehicle or EB1002 (n = 5 per group). p–r, Group average FOS heat map (p; scale bar, 500 µm), volcano plot of brain subregions (q) and heat map of activated brain regions involved in feeding, energy expenditure and reward (r) of wild-type DIO mice injected with vehicle or EB1002 (n = 8 per group). Data in j are mean, and data in all other graphs are mean ± s.e.m. *P < 0.05, **P < 0.01, ***P < 0.005, ****P < 0.0001. Detailed statistics are in the Supplementary Information and Source Data.

