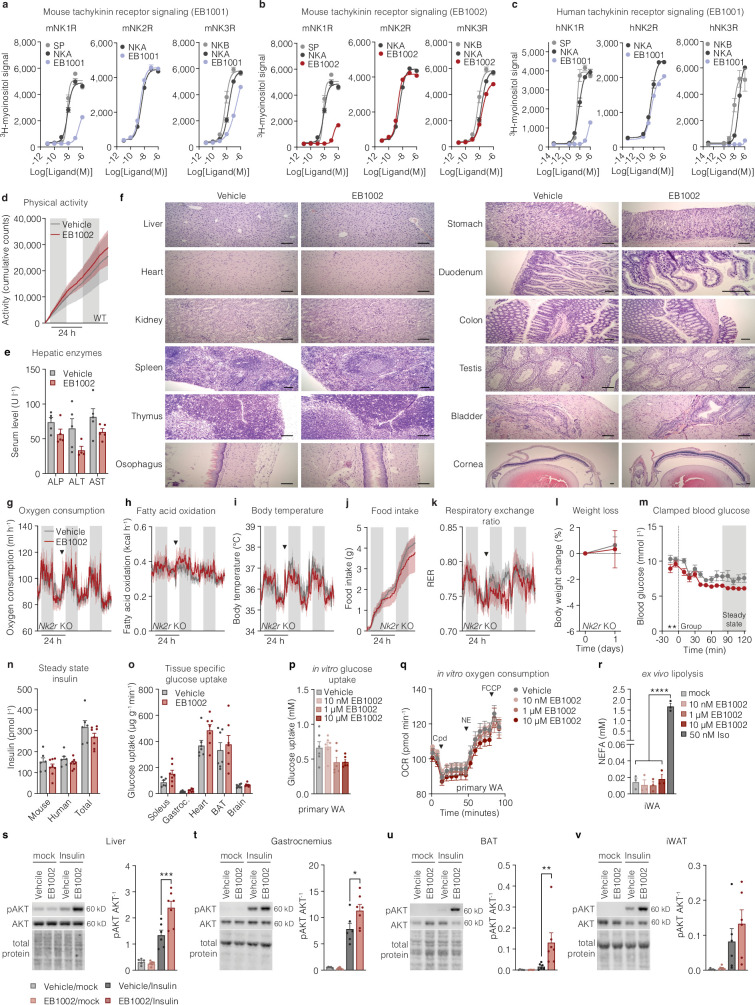
Extended Data Fig. 2. Development and acute testing of NK2R selective agonists.
a, Mouse tachykinin receptor signaling with endogenous ligands and EB1001, b, mouse tachykinin receptor signaling with endogenous ligands and EB1002, and, c, human tachykinin receptor signaling with endogenous ligands and EB1001, (n = 2 per variant for a-c). d, Cumulative locomotor activity of DIO mice following a single injection of vehicle (n = 6 mice) or 325 nmol/kg (n = 5 mice). e, Serum liver enzymes (n = 4 (ALT EB1002), n = 5 mice for remaining data) and f, representative microscopy images of various tissues of CD-1 mice after injections with vehicle or increasing concentrations of EB1002 (see methods, 7500 nmol/kg EB1002 prior to euthanasia), scale bars 100 µm. g, Oxygen consumption, h, fatty acid oxidation, i, body temperature, j, food intake, k, RER, and, l, weight loss of DIO Nk2r KO mice following a single injection of vehicle or 325 nmol/kg EB1002 (n = 6 mice per group for e, f, h-j, l, n = 5 mice per group for g), downward triangles signify time of injection. m, clamped blood glucose, n, steady state mouse and human insulin levels and o, glucose uptake into metabolically active tissues for a hyperinsulinemic-euglycemic clamp of lean mice following a single injection of vehicle (n = 7 mice) or 325 nmol/kg EB1002 (n = 8 mice). p, in vitro glucose uptake (n = 6 each condition) and q, oxygen consumption of primary white adipocytes (WA) in response to various concentrations of EB1002 (n = 6 (vehicle), n = 8 (each EB1002 concentration)). r, ex vivo lipolysis of mature inguinal WA in response to various concentrations of EB1002 and 50 nM isoproterenol (n = 3 each condition). Representative western blot images and quantification of s, liver, t, gastrocnemius, u, BAT and, v, iWAT of DIO mice treated with vehicle or 325 nmol/kg EB1002 18 h prior to injections with a mock solution or insulin (n = 5 (vehicle/mock), n = 6 (EB1002/mock, vehicle/insulin) n = 7 mice (EB1002/insulin)). Data are represented as mean ± s.e.m. For all: *P < 0.05, **P < 0.01, ***P < 0.005, ****P < 0.0001. Unpaired two-tailed t-test of AUC for 48 h after injection, d, g-k; unpaired two-tailed t-test, e, l, n, o; repeated measures two-way ANOVA with Geisser-Greenhouse correction, significance indicates treatment effect, m; ordinary one-way ANOVA with Tukey’s multiple comparisons test, significance shows post hoc test for treatment effect, p, r; ordinary one-way ANOVA of AUC for baseline, compound (cpd), NE and FCCP increments, q; and ordinary two-way ANOVA with Sidak’s multiple comparison, significance indicates post hoc test between vehicle and EB1002 treated mice, s-v. Uncropped blots are presented in Supplementary Fig. 1.

