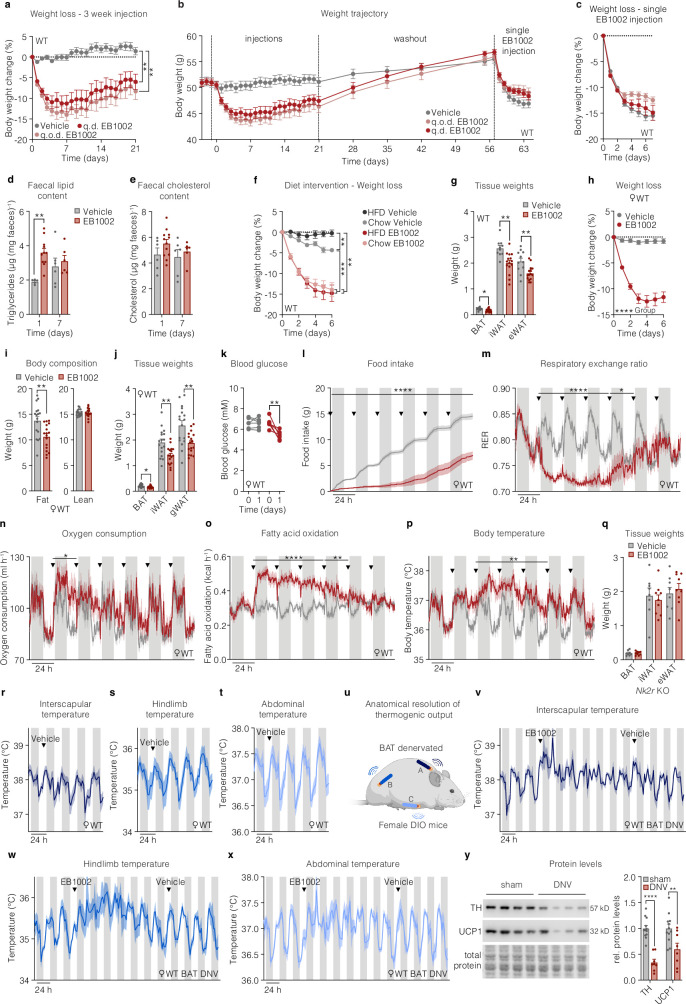
Extended Data Fig. 3. In vivo effects of repeated NK2R agonist dosing.
a, Weight loss of DIO mice that have been injected s.c. daily with vehicle or 325 nmol/kg EB1002 (q.d. EB1002), or every other day with 325 nmol/kg EB1002 (q.o.d. EB1002) (n = 10 mice per group), and b, weight trajectory of the same mice including a washout period and a single re-injection with 325 nmol/kg EB1002, with c, weight loss after re-injection. d, Faecal lipid content and e, faecal cholesterol content of DIO mice that have been injected s.c. daily with vehicle or 325 nmol/kg EB1002 (n = 6 mice (d1 vehicle and d7 vehicle and EB1002), n = 12 mice (d1 EB1002)). f, Weight loss of DIO mice that were transitioned to chow diet or continued on HFD 5 days prior to daily s.c. injections with vehicle or 325 nmol/kg EB1002, data normalized to d0 (n = 6 mice (HFD vehicle), n = 8 mice (chow vehicle, chow EB1002 and HFD EB1002)). g, Adipose tissue weights of DIO mice that have been injected s.c. daily with vehicle (n = 11 mice) or 325 nmol/kg EB1002 (n = 15 mice) for 7 days. h, Weight loss, i, body composition, j, adipose depot weights, k, blood glucose, l, food intake, m, RER, n, oxygen consumption, o, fatty acid oxidation, and p, body temperature of female DIO mice that have been injected s.c. daily with vehicle or 325 nmol/kg EB1002 (n = 6 mice per group (f, I, j-m), n = 17 mice per group (g, h), n = 6 mice (vehicle) and n = 5 mice (EB1002) for n), downward triangles signify time of injection. q, Adipose depot weights of DIO Nk2r KO mice that have been injected s.c. daily with vehicle (n = 8 mice) or 325 nmol/kg EB1002 (n = 9 mice). r, Interscapular temperature (n = 3 mice), s, hindlimb temperature (n = 5 mice), t, abdominal temperature (n = 5 mice) of DIO mice after a single s.c. injection of vehicle, downward triangles signify time of vehicle injection. u, Schematic setup of triple chip study to interrogate anatomical resolution of thermogenic output with v, interscapular temperature, w, hindlimb temperature, and x, abdominal temperature of BAT denervated DIO mice after a single injection of 325 nmol/kg EB1002 and vehicle (n = 3 mice), downward triangles signify time of injection of the indicated compound. y, Representative western blot images and quantification of BAT from sham operated or BAT denervated mice (n = 6 (sham), n = 4 mice (DNV), each BAT lobe has been analyzed separately). Data are represented as mean ± s.e.m. For all: *P < 0.05, **P < 0.01, ***P < 0.005, ****P < 0.0001. Repeated measures two-way ANOVA with Geisser-Greenhouse correction and Tukey’s multiple comparison test, significance indicates post hoc test for treatment effect at last timepoint, a, f; repeated measures two-way ANOVA with Geisser-Greenhouse correction, significance indicates treatment effect, c, h; repeated measures two-way ANOVA with Geisser-Greenhouse correction and Sidak’s multiple comparison test, significance indicates post hoc test for treatment effects, d, e; unpaired two-tailed t-test, g, i, j, q, y; repeated measures two-way ANOVA and Sidak’s multiple comparison, significance indicates time effect, k; unpaired two-tailed t-test of AUC of 24 h increments, l-p.

