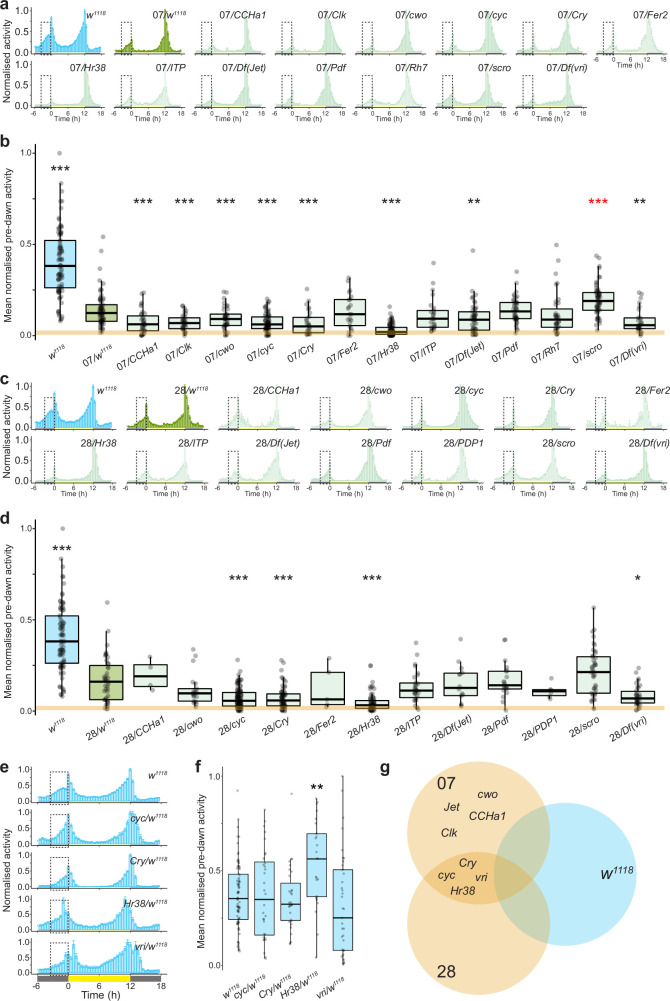
Extended Data Fig. 5. Screen results for the genetic basis of interspecific differences in morning activity.
a, Mean normalised activity of the indicated genotypes under 12:12 h LD. Dashed boxes highlight the pre-dawn area used to quantify pre-dawn activity, 3 h before lights-on. Error bars represent SEM. Sample sizes: w1118 (78), 07/w1118 (69), 07/CCHa1 (21), 07/Clk (34), 07/cwo (43), 07/cyc (43), 07/Cry (26), 07/Fer (18), 07/Hr38 (87), 07/ITP (23), 07/Jet (49), 07/Pdf (42), 07/Rh7 (33), 07/scro (58), 07/vri (28), 07 (40). b, Mean normalised pre-dawn activity for the genotypes in a. Asterisks indicate significant differences: ** = P < 0.01 and *** = P < 0.001 (Wilcoxon tests comparing each test hybrid to the control hybrid strain (07/w1118) with Bonferroni correction). Red asterisks denote a significant increase in morning activity relative to control hybrids. The orange line marks the median pre-dawn activity of the D. sechellia parental strain (07). c, Mean normalised activity of the indicated genotypes under 12:12 h LD. Dashed boxes highlight the pre-dawn area used to quantify pre-dawn activity, 3 h before lights-on. Error bars represent SEM. Sample sizes: w1118 (78), 28/w1118 (22), 28/CCHa1 (4), 28/cwo (20), 28/cyc (56), 28/Cry (66), 28/Fer (5), 28/Hr38 (43), 28/ITP (25), 28/Jet (22), 28/Pdf (21), 28/PDP1 (14), 28/scro (38), 28/vri (33), 28 (36). d, Mean normalised pre-dawn activity for the genotypes in c. Asterisks indicate significant differences: * = P < 0.05 and *** = P < 0.001 (Wilcoxon tests comparing each test hybrid to the control hybrid strain (28/w1118) with Bonferroni correction). The orange line marks the median pre-dawn activity of the D. sechellia parental strain (28). e, Mean normalised activity of the indicated hemizygous D. melanogaster genotypes that displayed an effect in a hybrid background under 12:12 h LD. Dashed boxes highlight the pre-dawn area used to quantify pre-dawn activity. Plots depict average activity of the last 4 days of a 7-day recording period. Dashed boxes highlight the pre-dawn period, 3 h before lights-on. Error bars represent SEM. Sample sizes: w1118 (78), cyc/w1118 (31), Cry/w1118 (32), Hr38/w1118 (25), vri/w1118 (46). f, Mean normalised pre-dawn activity for the genotypes in e. Asterisks indicate significant differences: Hr38 hemizygotes displayed a significant increase in morning peak activity compared to the control strain (w1118). ** = P < 0.01 (Wilcoxon tests comparing each test hemizygote to the control strain (w1118) with Bonferroni correction). g, Summary of the overlapping hits from each of the above genotypes. A priori, we considered the strongest candidates to display a reduction in morning peak activity in Dsec07 and Dsec28 hybrids, but not in w1118 hemizygotes. Four genes fulfilled these criteria: cyc, Cry, Hr38 and vri.

