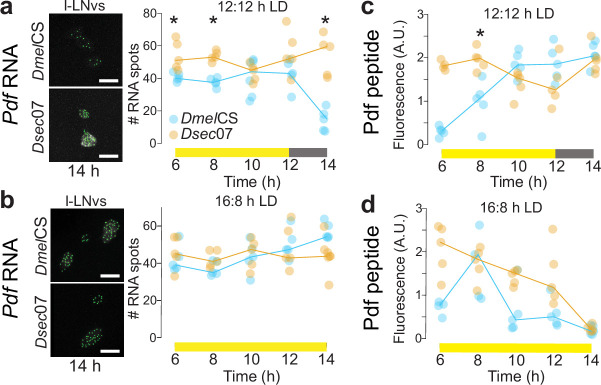
Extended Data Fig. 7. Pdf expression in the l-LNvs of D. melanogaster and D. sechellia during the evening peak period.
a,b, Left: representative images of Pdf smFISH in the l-LNv soma in DmelCS and Dsec07 under 12:12 h LD (a) or 16:8 h LD (b) at one timepoint (14 h), with RNA spots (green) identified by RS-FISH. Right: quantifications of RNA spots at 5 timepoints spanning the evening activity peak period. c,d, Quantifications of Pdf signals in the l-LNv soma for DmelCS and Dsec07 at 5 timepoints spanning the evening activity peak period under 12:12 h LD (c) and 16:8 h LD (d). For a-d, lines connect medians of each timepoint within genotypes. * = P < 0.05 (Pairwise Wilcoxon tests with Bonferroni correction).

