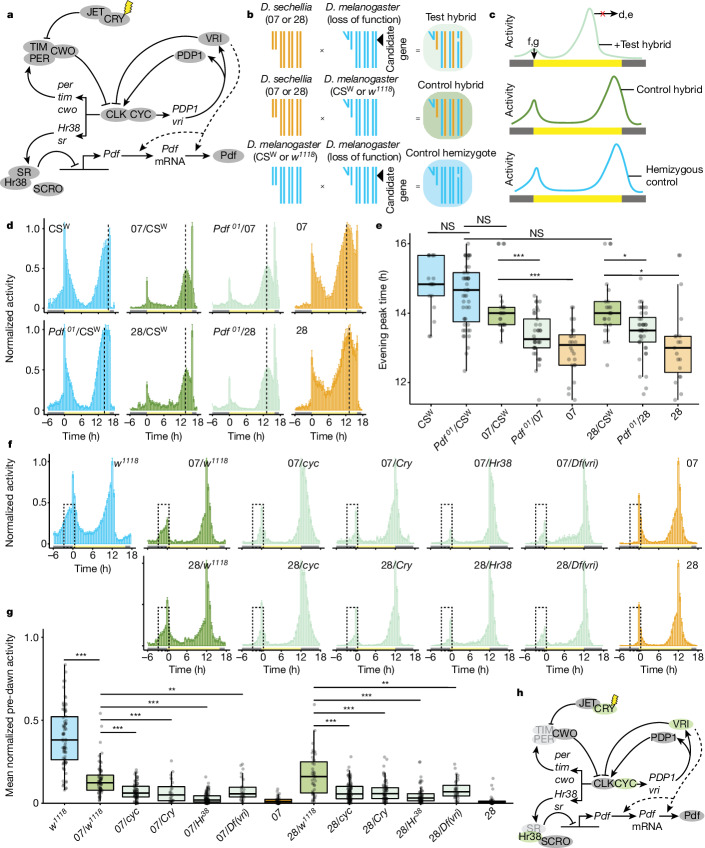
Fig. 2. Genetic screens for interspecific circadian differences.
a, The D. melanogaster circadian clock. Arrows denote transcriptional activation, blunt-ended connectors represent repression/degradation and dashed lines indicate hypothesized connections. b, Crossing schemes of the genetic screen. The fourth chromosome is not shown. c, Schematics illustrating the sought-after behavioural phenotypes of hybrid genotypes. d, Mean normalized activity of the indicated genotypes under 16:8 h LD. n: CSW (16), Pdf01/CSW (47), 07/CSW (25), 28/CSW (23), 07/Pdf01 (37), 28/Pdf01(40), 07 (24), 28 (19). Full screen results are given in Extended Data Fig. 3. e, Evening peak time for the flies depicted in d. *P < 0.05, ***P < 0.001 (Wilcoxon tests with Bonferroni correction). Comparisons were made only between control and test hybrids of the same genetic backgrounds. f, Mean normalized activity of the indicated genotypes under 12:12 h LD, illustrating the mutations showing reduced morning activity in test hybrids. Dashed boxes highlight the predawn area used to quantify predawn activity, 3 h before lights-on. Error bars represent s.e.m. Full screen results are shown in Extended Data Fig. 5. g, Mean normalized predawn activity for the genotypes shown in f. **P < 0.01, ***P < 0.001 (Wilcoxon tests comparing each test hybrid with the appropriate control hybrid strain, with Bonferroni correction). h, The circadian molecular network, in which screen hits for morning activity are highlighted in green; genes depicted in light grey could not be tested (Methods). mRNA, messenger RNA; NS, not significantly different.

