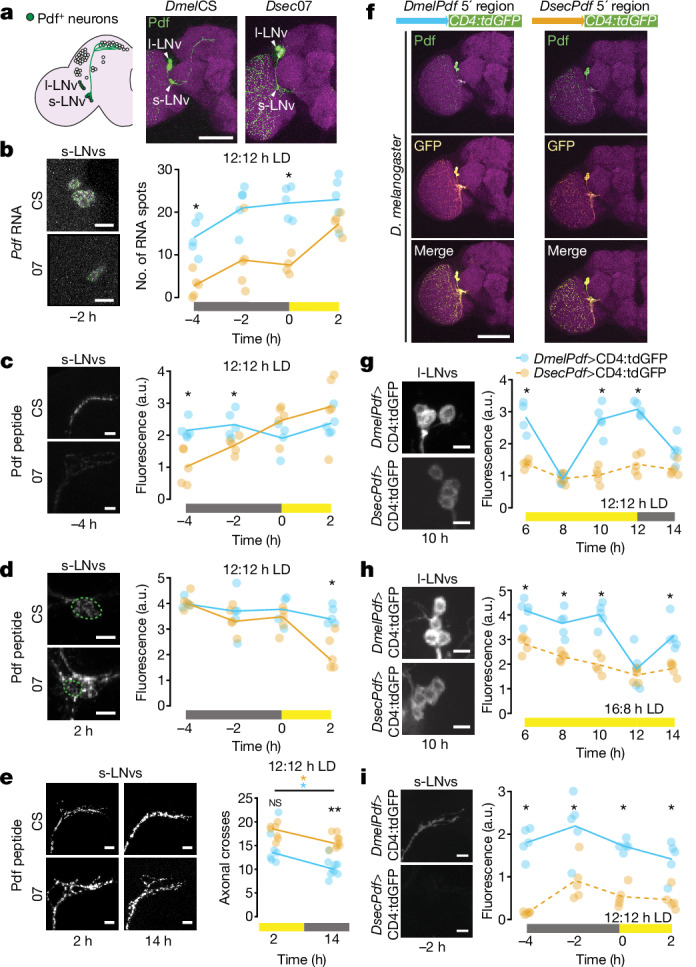
Fig. 3. Species-specific cis-regulatory elements affect Pdf expression.

a, Schematic of the D. melanogaster circadian clock neuron network. Pdf-positives-LNvs and l-LNvs are highlighted. Immunofluorescence for Pdf (green) and cadherin-N (magenta) on brains of the indicated strains at 2 h under 12:12 h LD. b–d, Left, representative images of Pdf smFISH (b) and Pdf immunofluorescence (c,d) in s-LNv soma (b,d) and axon termini (c) for strains under 12:12 h LD at the indicated time points. Right, quantifications of each strain at four time points spanning the predawn period. e, Left, Pdf immunofluorescence in s-LNv axon termini for indicated strains during the day (2 h) and night (14 h) under 12:12 h LD. Right, quantifications of axonal branching complexity using Scholl analysis. n: CS 2 h (7), 07 2 h (7), CS 14 h (9), 07 14 h (9). f, Top, schematic illustrating Pdf transcriptional reporters. Bottom, immunofluorescence for Pdf (green), GFP (yellow) and cadherin-N (magenta) in brains of D. melanogaster (at 2 h) expressing species-specific Pdf reporters. g–i, Left, representative images of GFP immunofluorescence in l-LNvs (g,h) and s-LNv axonal projections (i) for Dmel and DsecPdf 5’-regulatory reporter strains under 12:12 h LD (g,i) and 16:8 h LD (h) at the indicated time points. Right, quantifications at time points spanning the evening activity peak period (g,h) and predawn period (i). Although signals are weak in some Dsec images, the structures were readily identified in thresholded images. b–e,g–i, Plotted values are the average of both hemispheres; lines connect medians of time points within genotypes. *P < 0.05, **P < 0.01 (Wilcoxon tests with Bonferroni correction). Scale bars, 100 μm (a,f), 10 μm (b–e, g–i). b–d,g–i, n = 5 brains per strain per time point. a.u., arbitrary units.
