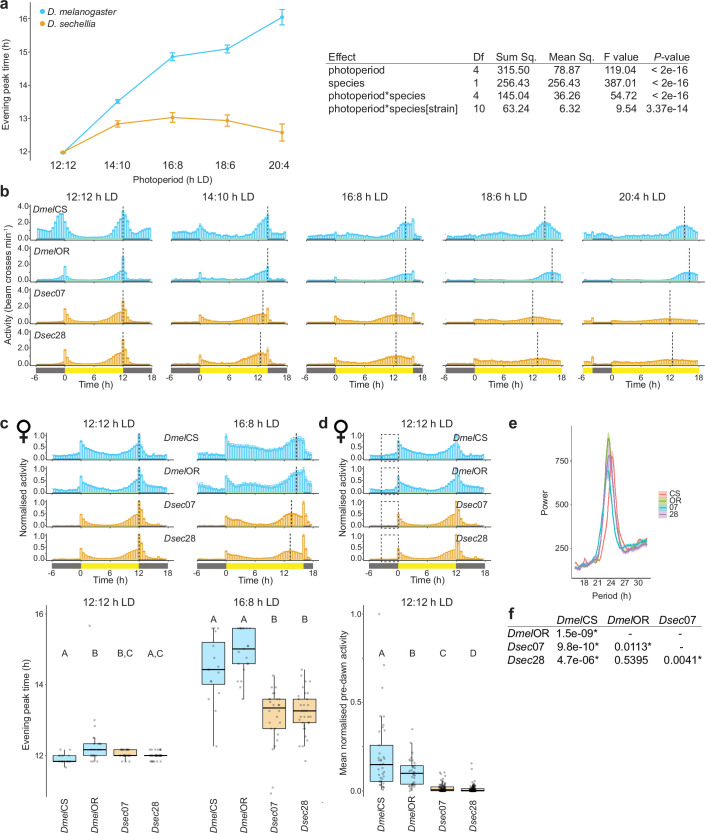
Extended Data Fig. 1. Activity of D. melanogaster and D. sechellia males and females under different photoperiods.
a, Left: reaction norm depicting the interaction between species and photoperiod in determining evening peak time. Points represent species means and error bars represent SEM. Right: results of a two-way nested ANOVA detecting a significant interaction between species and photoperiod in determining evening peak time. b, Mean non-normalised activity of flies from Fig. 1c. Vertical dashed lines indicate the average timing of the evening peak for each strain. Error bars represent SEM. Sample sizes as in Fig. 1c. c, Top: mean normalised activity of two D. melanogaster (CS and OR, blue) and two D. sechellia (07 and 28, orange) strains, using female flies, under the indicated photoperiods. Plots depict normalised average activity of the last 4 days of a 7-day photoperiod; for 16:8 h LD, this was preceded by 7 days of 12:12 h LD. Bottom: box plots depict evening peak time quantifications for individual flies under each photoperiod. Here and elsewhere, box plots show the median (bold line), interquartile range (box) and final quartiles (whiskers). Individual data points are overlaid on the box plots; outliers are points that fall beyond the box plot whiskers. Sample sizes (numbers of individual flies) are: 12:12 h LD: CS (37), OR (34), 07 (95), 28 (146); 16:8 h LD: CS (16), OR (21), 07 (30), 28 (33). For b-c, Vertical dashed lines indicate the average timing of the evening peak for each strain. Here and elsewhere, yellow and grey bars indicate timing of lights-on and lights-off, respectively. Error bars represent SEM. d, Mean normalised activity of D. melanogaster and D. sechellia strains under 12:12 h LD during the morning activity peak (same data from c). Top: plots depict average activity of the last 4 days of a 7-day recording period. Dashed boxes highlight the pre-dawn period, 3 h before lights-on. Error bars represent SEM. Bottom: mean normalised activity of individual flies within this pre-dawn period. Sample sizes as in c. For c-d, letters indicate significant differences: P < 0.05 (pairwise Wilcoxon test with Bonferroni correction). e, Periodogram analysis from 5 days of constant darkness (DD) for D. melanogaster (CS and OR) and D. sechellia (07 and 28) strains. Period estimates: CS (24.36 h), OR (23.45 h), 07 (23.16 h), 28 (23.57 h). Sample sizes as in Fig. 1e. f, Table of P-values from all pairwise comparisons of the data in e between strains (Wilcoxon test with Bonferroni correction). No species-specific differences were observed.

