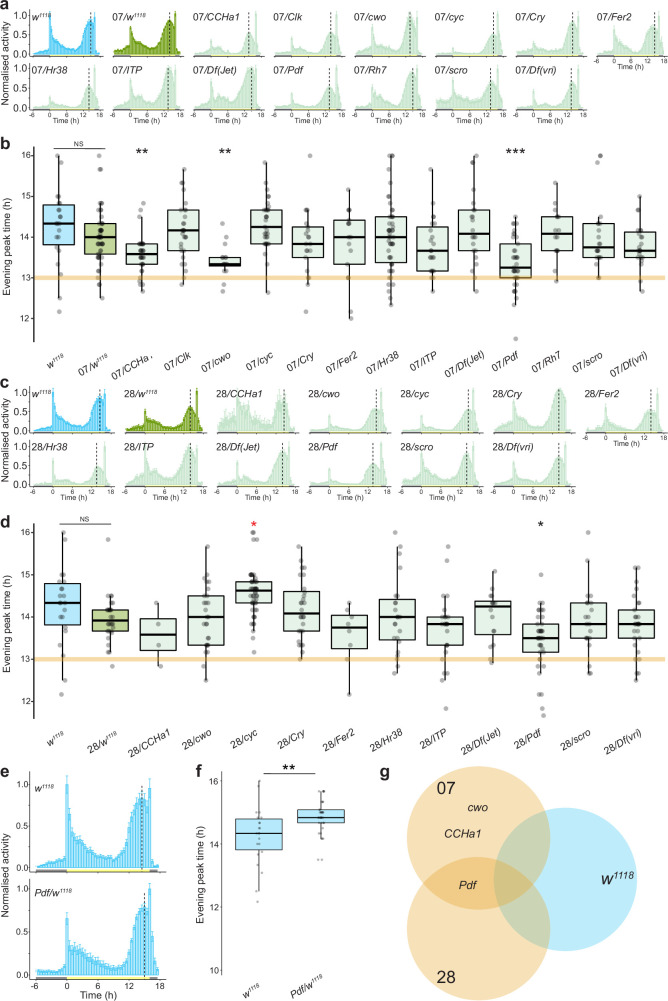
Extended Data Fig. 3. Screen results for the genetic basis of interspecific differences in evening peak plasticity.
a, Mean normalised activity of the indicated control and hybrid genotypes under 16:8 h LD. Plots depict average activity of the last 4 days of a 7-day extended photoperiod, following 7 days of 12:12 h LD. Vertical dashed lines indicate the average timing of the evening peak for each genotype. Error bars represent SEM. Sample sizes: w1118 (22), 07/w1118 (53), 07/CCHa1 (34), 07/Clk (29), 07/cwo (16), 07/cyc (33), 07/Cry (21), 07/Fer2 (17), 07/Hr38 (50), 07/ITP (23), 07/Jet (22), 07/Pdf (37), 07/Rh7 (16), 07/scro (22), 07/vri (23), 07 (24). b, Evening peak time for the genotypes in a. Asterisks indicate significant differences: ** P < 0.01 and *** = P < 0.001 (Wilcoxon tests comparing each test hybrid to the control hybrid strain (07/w1118) with Bonferroni correction). NS = not significantly different. The orange line marks the median evening peak delay of the D. sechellia parental strain (07). c, Mean normalised activity of the indicated control and hybrid genotypes under 16:8 h LD. Plots depict average activity of the last 4 days of a 7-day extended photoperiod, following 7 days of 12:12 h LD. Vertical dashed lines indicate the average time of the evening peak for each strain. Error bars represent SEM. Sample sizes: w1118 (22), 28/w1118 (31), 28/CCHa1 (4), 28/cwo (27), 28/cyc (52), 28/Cry (28), 28/Fer (8), 28/Hr38 (23), 28/Itp (25), 28/Jet (16), 28/Pdf (40), 28/scro (31), 28/vri (29), 28 (19). d, Evening peak time for the genotypes in c. Asterisks indicate significant differences: * = P < 0.05 (Wilcoxon tests comparing each test hybrid to the control hybrid strain (28/w1118) with Bonferroni correction). Red asterisk denotes a significant increase in evening peak plasticity. NS = not significantly different. The orange line marks the median evening peak delay of the D. sechellia parental strain (28). e, Mean normalised activity of hemizygous D. melanogaster Pdf mutants (the only mutant that displayed an effect in both hybrid backgrounds) under a 16:8 h LD cycle. Plots depict average activity of the last 4 days of a 7-day extended photoperiod, following 7 days of 12:12 h LD. Vertical dashed lines indicate the average time of the evening peak for each strain. Error bars represent SEM. Sample sizes: w1118 (22), Pdf/w1118 (37). f, Evening peak time for the flies depicted in e. Pdf01 hemizygotes displayed a significant increase in morning peak activity compared to the control strain (w1118). ** = P < 0.01 (Wilcoxon test). g, Summary of the overlapping hits. A priori, we considered the strongest candidates would display a reduction in evening peak plasticity in both Dsec07 and Dsec28 hybrids, but not in w1118 hemizygotes; only Pdf fulfilled these criteria.

