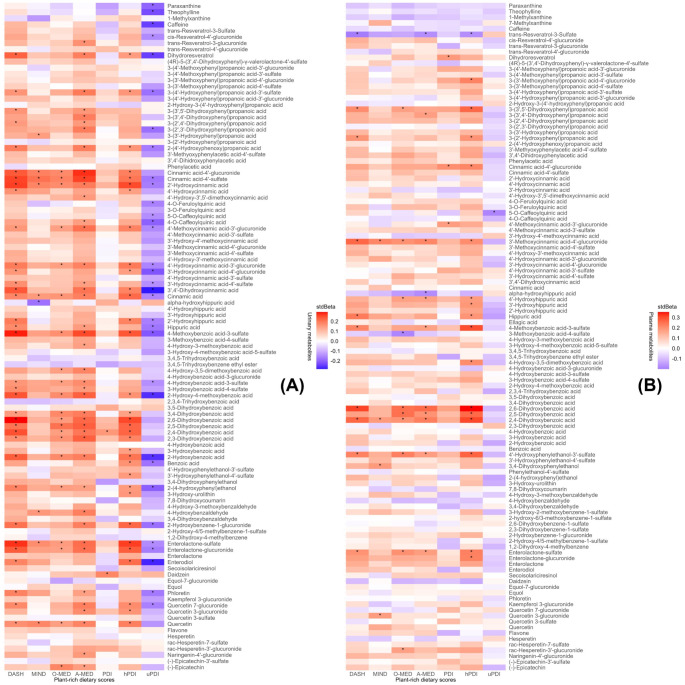
Fig. 2.
Association between (A) urinary and (B) plasma metabolites and plant-rich dietary scores. The heatmap was plotted according to the standardized regression coefficients (stdBeta). The colour scale indicates the effect (stdBeta) of each urinary or plasma metabolite on plant-rich dietary scores. Red and blue illustrate positive and negative effects, and colour intensity represents the degree of effect. The asterisks showed significance (*: FDR-adjusted p < 0.05). DASH, Dietary Approaches to Stop Hypertension; MIND, Mediterranean-DASH Intervention for Neurodegenerative Delay; O-MED, Original Mediterranean Score; A-MED, Amended Mediterranean Score; PDI, Plant-based Diet Index; hPDI, Healthy Plant-based Diet Index; uPDI, unhealthy Plant-based Diet Index. The associations were adjusted for energy intake

