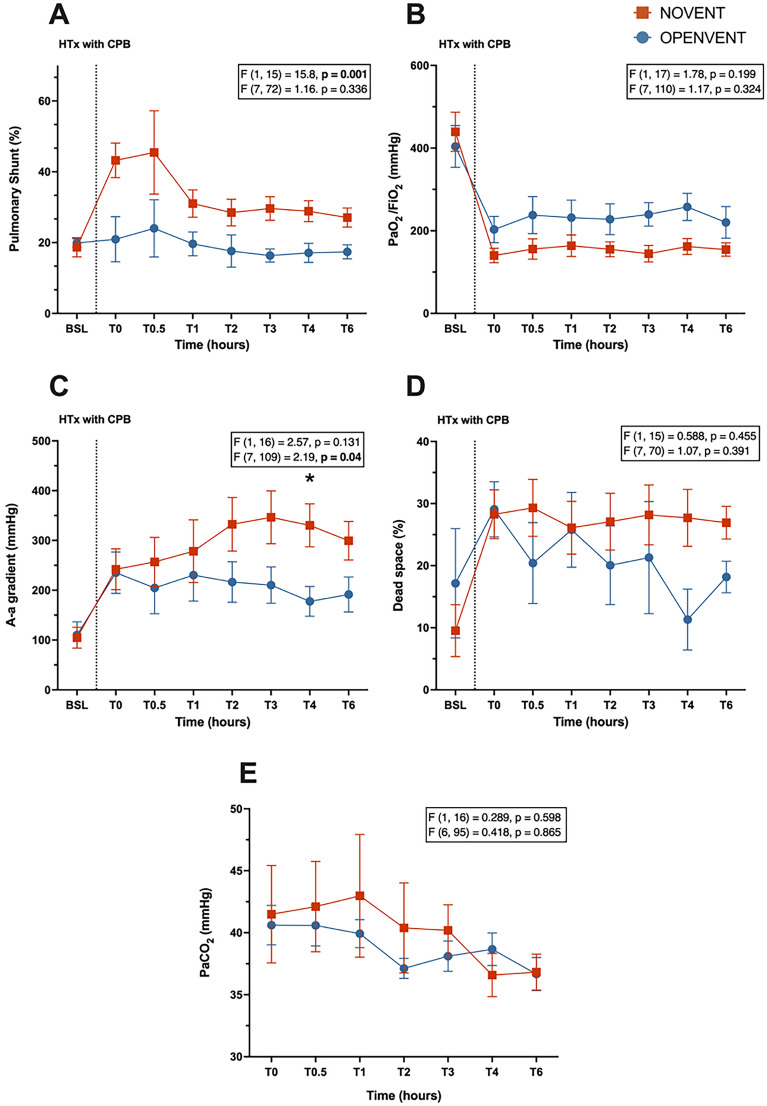
Fig. 6.
A Pulmonary shunt (%), B PaO2/FiO2 ratio (mmHg), C A-a gradient (mmHg), D physiological dead space (%), E PaCO2 (mmHg) during 6-h post-transplantation monitoring period in recipient sheep treated with either no ventilation (NOVENT ■) or open-lung ventilation (OPENVENT ●) during cardiopulmonary bypass. Data shown as mean ± SEM from preoperative baseline (BSL) through to 6 h postoperative (T6), with n = 9 for both groups. F (a, b) = c, a represents the between group variance, b the within-group variance, the F value (c) is the ratio of the variation between sample means/ variation within samples. Top F and p values refer to effect of ventilation strategy on outcome, and bottom F and p values refer to the combined effects of ventilation strategies and time (interaction term)

