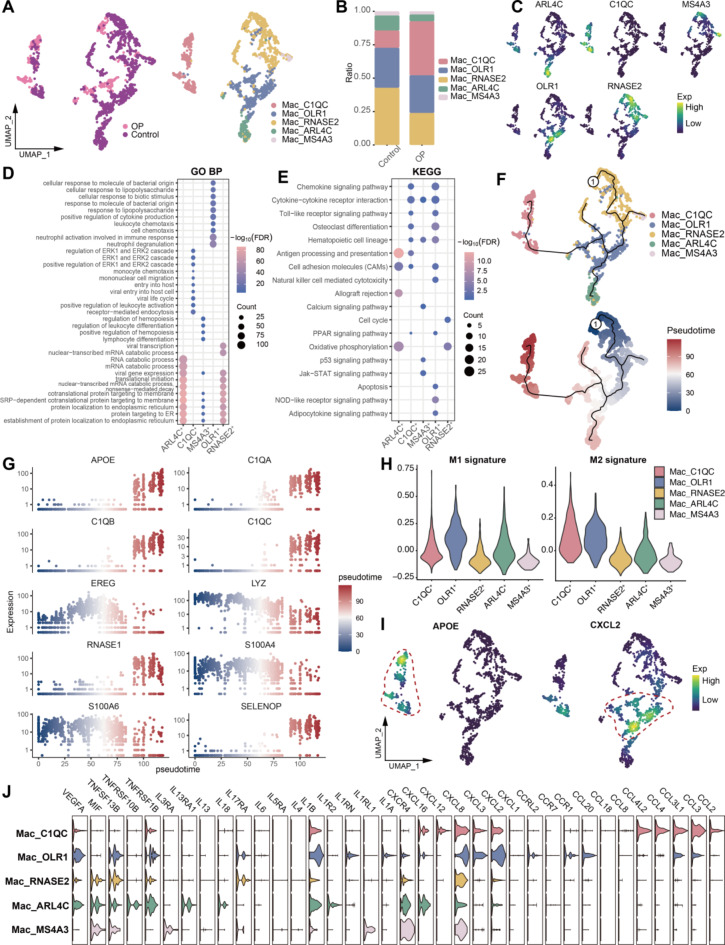
Fig. 3.
Identification and analysis of macrophage subpopulations. (A) Macrophage subpopulations in the OP microenvironment. (B) Bar graph showing the difference in macrophage abundance between control and osteoporosis patients. (C) Density map mapping of cell subpopulation-specific marker expression in macrophage subpopulations. (D-E) Bubble plots showing biological processes and pathways that are significantly activated in macrophage subpopulations. GO BP: Gene Ontology Biological Process; KEGG: Kyoto Encyclopedia of Genes and Genomes. (F) Pseudotime developmental trajectories of macrophage subpopulations. (G) Dynamic expression of genes of interest along the differentiation trajectory of macrophage subpopulations. (H) Expression of M1 and M2 signatures of macrophage subpopulations. (I) Density map of the expression of APOE and CXCL2 in macrophage subpopulations. (J) Violin plots show cytokine expression of macrophage subpopulations.

