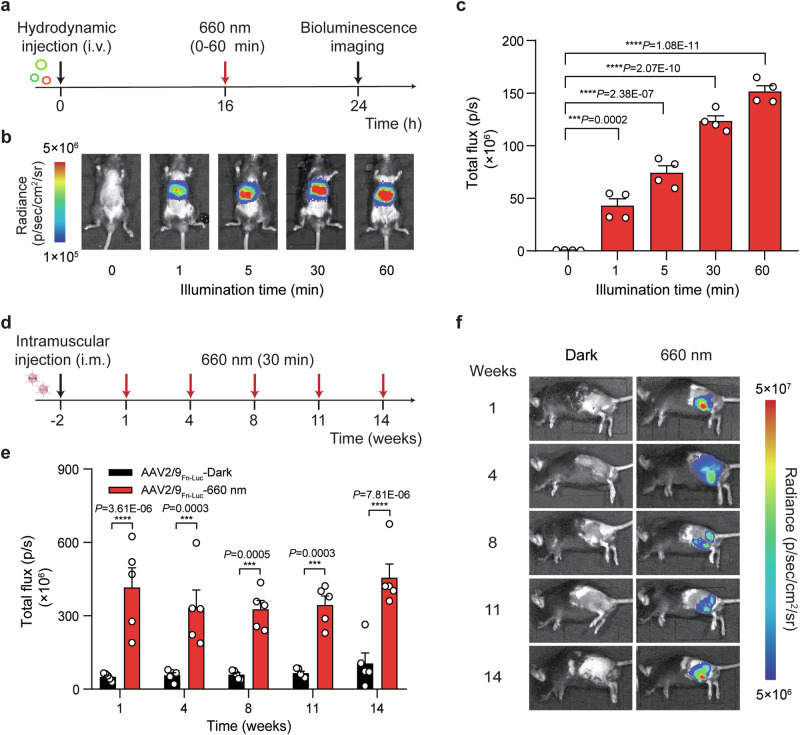
Fig. 4. Fn-REDLIP-mediated transgene expression in mice.
a Schematic representation of the experimental procedure and the time schedule for Fn-REDLIP-mediated transgene expression in mouse livers. b, c Exposure time-dependent Fn-REDLIP-mediated transgene expression kinetics in mice. Mice were hydrodynamically injected (tail vein) with Fn-REDLIP-encoding plasmids. At 16 h post-injection, the mice were illuminated with RL (660 nm, 20 mW/cm2) for the indicated time periods (0–60 min). The bioluminescence signal was quantified 8 h after illumination using an in vivo imaging system. d–f AAV-serotype of 2/9 delivery of the Fn-REDLIP-mediated transgene expression in mice. d Schematic representation of the experimental procedure and time schedule for the AAV2/9 delivery of Fn-REDLIP-mediated transgene expression in the mouse left gastrocnemius muscle. Mice were intramuscularly injected with a mixture of AAV vectors encoding the Fn-REDLIP system [(pQL382 (ITR-PEMS-Gal4 DBD-FnBphP-pA-ITR) and pNX137 (ITR-PEMS-LDB3-p65-HSF1-pA-ITR)] and the luciferase reporter pQL271 (ITR-PRL-Luciferase-pA-ITR) at an AAV titer of 2 × 10¹¹ Vector Genomes (vg). After 2 weeks, mice were illuminated at an intensity of 20 mW/cm2 for 30 min once every three or four weeks. e Bioluminescence was quantified 8 h after illumination. f Bioluminescence measurements of long-term activated luciferase expression of the AAV-delivered Fn-REDLIP system in mice under RL illumination. Data in (c, e) are presented as means ± SEM (c, n = 4 mice; e, n = 5 mice). P values in (c) were calculated by one-way ANOVA with multiple comparisons. P values in (e) were calculated using a two-tailed unpaired t-test. ***P < 0.001, ****P < 0.0001. Detailed bioluminescence images of the mice are provided in Supplementary Figs. 10a, 12. Source data are provided as a Source Data file.

