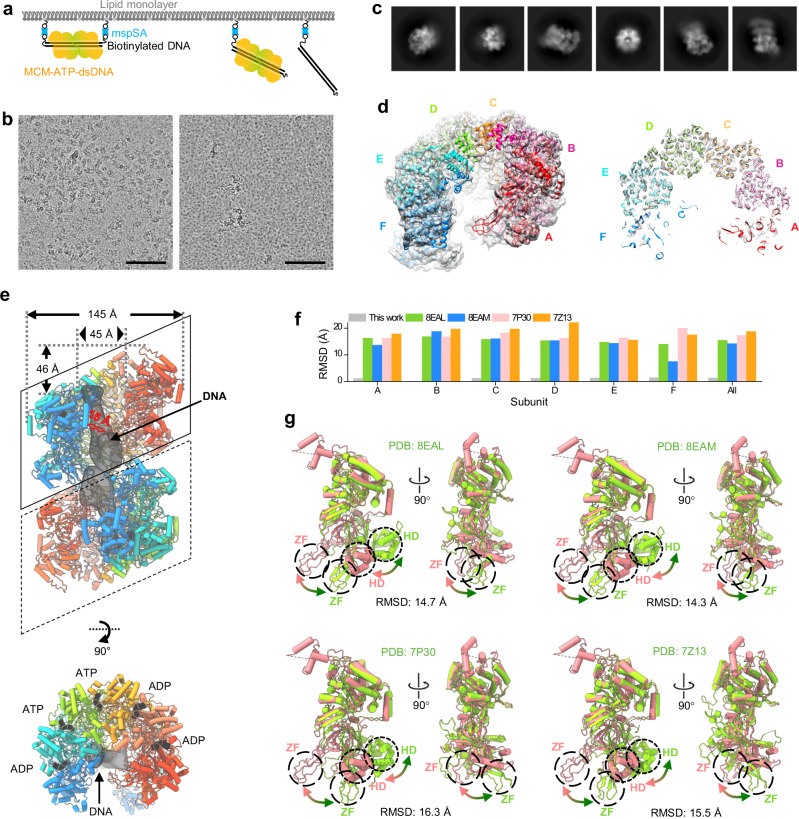
Fig. 3. CryoEM structure of MCM-ATP-dsDNA captured by mspSA affinity grids.
a The design of mspSA affinity-capture of biotin-tagged dsDNA in complex with MCM and ATP. b Representative micrographs of MCM-ATP-dsDNA on mspSA affinity grids at 0.07 mg/ml concentration with (left) and without (right) biotin-tag on both ends of dsDNA. The SA used is 0.04 mg/ml. Scale bars, 100 nm. The experiment was repeated two times independently with similar results. The number of image is 31 (without biotin-tag) and 21 (with biotin-tag). c 2D classes of MCM-ATP-dsDNA show flexible double MCM hexamer. d A side view (left panel) and a middle slice (right panel) of the cryoEM map of the MCM-ATP-dsDNA hexamer at 3.57 Å resolution overlapped with the atomic models of subunits (colored). The model of the best-resolved subunit was first built and refined, which was subsequently used to refine all other subunits. The peripheral subunits (both the red and blue subunits) are less well resolved. e Structure of MCM-ATP-dsDNA double hexamer, where the bottom MCM was docked using the model from the top MCM. The nucleotide (ADP or ATP) bound between two subunits is clearly resolved. The density of DNA located in the central channel of double MCM hexamers is low passed to 16 Å. The distances were measured with the same method as described in Fig. 2e. f RMSD values between the B subunit of MCM-ATP-dsDNA and the B subunit of other published MCM-dsDNA structures (colored accordingly). The gray bar indicates the averaged RMSD between the B subunit and other subunit of MCM-ATP-dsDNA. Source data are provided as a Source Data file. g The B subunit of MCM-ATP-dsDNA (pink) superimposed with the B subunit of other published MCM structures (green) aligned on CTD. Large shifts occur at the HD and ZF subdomains (circled), as indicated by arrows.

