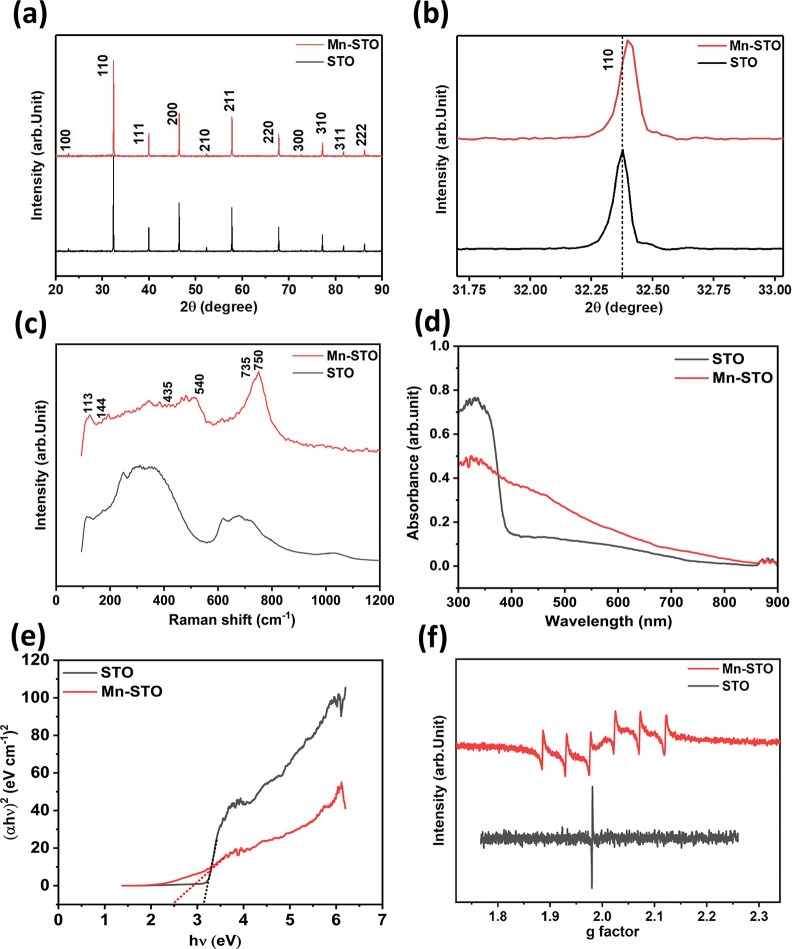
Figure 1.
(a) Powder XRD pattern of the STO and Mn-STO samples. (b) Magnified view of the 110 plane showing a peak shift in Mn-STO. (c) Comparison of Raman spectra of STO and Mn-STO. (d) UV–visible spectra of STO and Mn-STO and (e) corresponding Tauc's plot to find the band gap. (f) EPR spectra of STO and Mn-STO.

