
Figure 2.
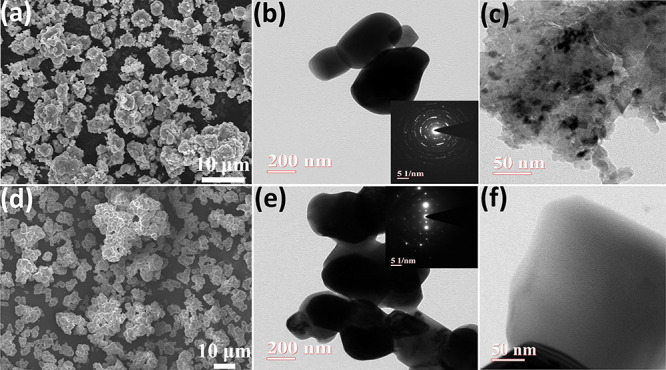
FESEM images of (a) STO and (d) Mn-STO. TEM images of (b, c) STO and (e, f) Mn-STO (inset figures display the SAED pattern of STO and Mn-STO).
Official websites use .gov
A
.gov website belongs to an official
government organization in the United States.
Secure .gov websites use HTTPS
A lock (
) or https:// means you've safely
connected to the .gov website. Share sensitive
information only on official, secure websites.
FESEM images of (a) STO and (d) Mn-STO. TEM images of (b, c) STO and (e, f) Mn-STO (inset figures display the SAED pattern of STO and Mn-STO).