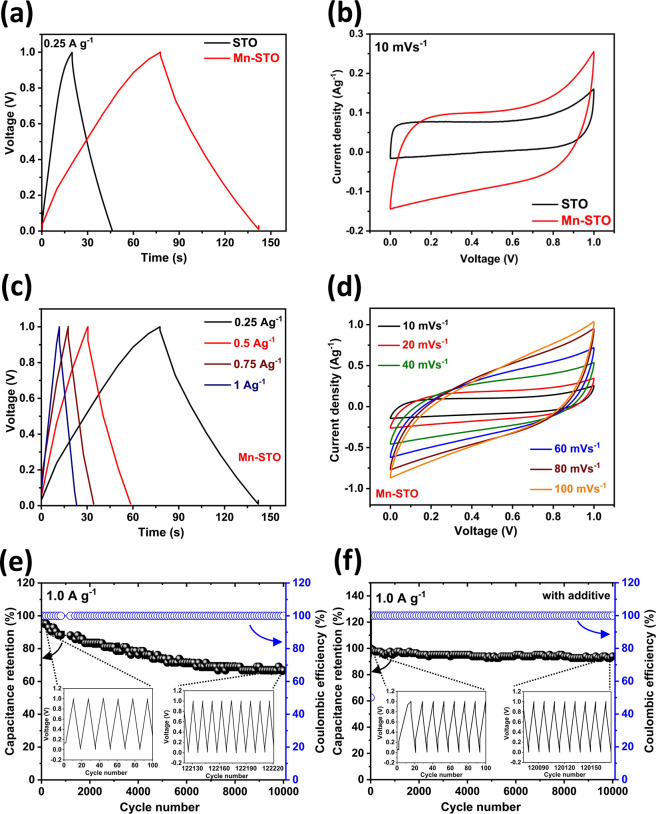
Figure 5.
Comparison of (a) galvanostatic charge–discharge curve at a current density of 0.25 A g–1 and (b) cyclic voltammogram at a scan rate of 10 mV s–1 of STO and Mn-STO symmetric cells in a 3 M KOH aqueous electrolyte. (c) Galvanostatic charge–discharge at different current densities and (d) cyclic voltammogram at different scan rates of the symmetric Mn-STO supercapacitor. Cycling stability measurement of the Mn-STO symmetric supercapacitor at a current density of 1 A g–1 (e) without adding an additive and (f) with a 0.1 M MnSO4 electrolyte additive in an aqueous 3 M KOH electrolyte up to 10,000 cycles.

