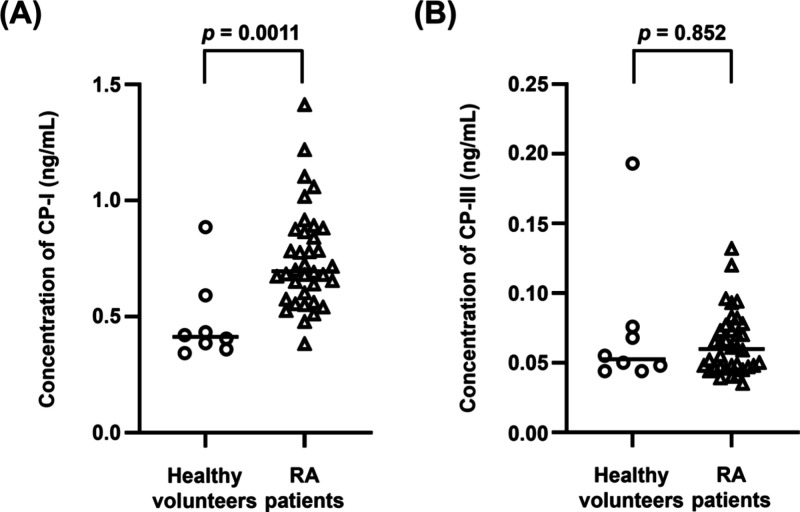
Figure 4.
Plasma concentrations of CP-I (A) and CP-III (B) in healthy volunteers and RA patients. The levels of CP-I and CP-III in healthy volunteers and RA patients did not show Gaussian distribution based on the Shapiro–Wilk test. Thus, comparison between the two groups was analyzed by the Mann–Whitney U test. The horizontal bars in each group indicate the median value. CP-I, coproporphyrin-I; CP-III, coproporphyrin-III; and RA, rheumatoid arthritis.

