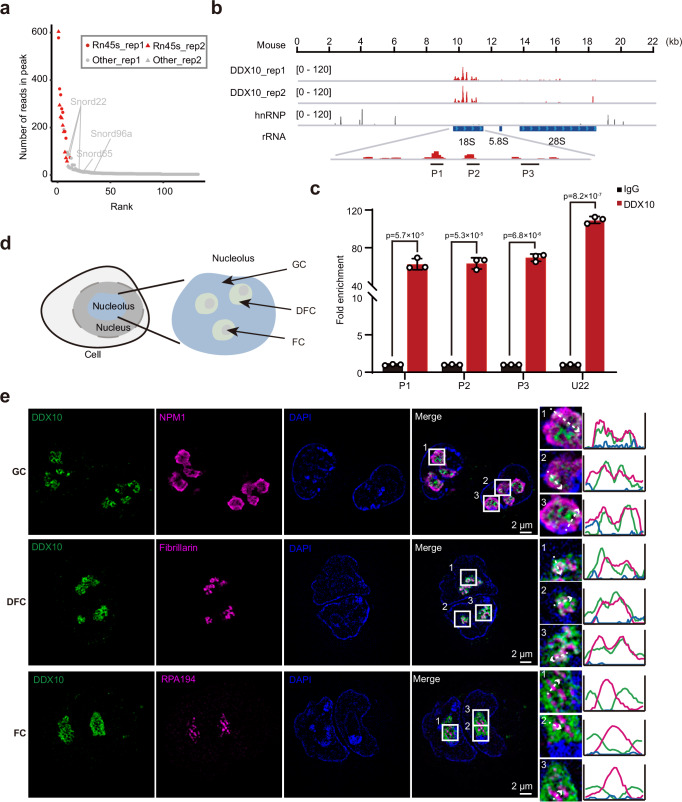
Fig. 2. Localization and binding preferences of DDX10 in the nucleolus.
a Scatter plot showcasing the read distribution in DDX10 peaks from CLIP-seq data. b Genomic tracks illustrating DDX10 enrichment at 45S rRNA through CLIP-seq. Control hnRNP CLIP-seq data was used. c RIP-qPCR validating DDX10 positive binding loci in FLAG-tagged DDX10 mESCs. Data are presented as mean values ± SD with the indicated significance from two-sided t-test. Exact p-values are reported in the figure. n = 3 independent experiments. d Schematic representation illustrating the nucleolus structure. e Representative SIM images of DDX10 (green), GC marker NPM1 (magenta), DFC marker Fibrillarin (magenta), and FC marker RPA194 (magenta) in mESCs. Experiments were repeated three times independently with similar results. Scale bar, 2 µm. Source data are provided as a Source Data file.

