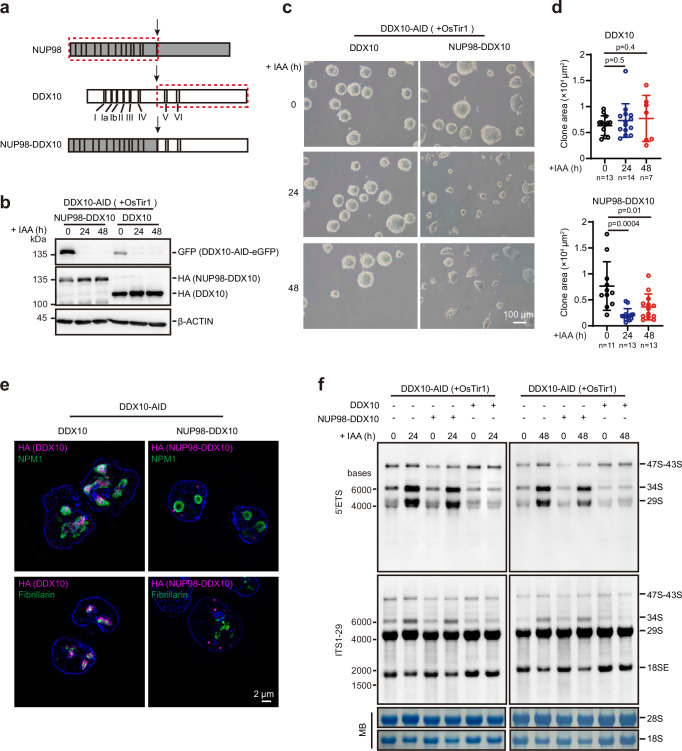
Fig. 6. NUP98-DDX10 fusion protein lacks the function in ribosome biogenesis regulation.
a Cartoon diagram illustrating the translocation of NUP98-DDX10 fusion protein, with the red dotted box representing the gene fusion segment. I-VI represent the conserved domains of DDX10. b Western blot depicting protein levels of NUP98-DDX10 and full-length DDX10, and endogenous DDX10 levels after treatment with IAA at different time points (0 h, 24 h, and 48 h). Experiments were repeated two times independently with similar results. c Brightfield images of mESCs overexpressing DDX10 or NUP98-DDX10 after DDX10 degradation with IAA treatment at different time points (0 h, 24 h, and 48 h). Scale bar, 100 µm. Experiments were repeated three times independently with similar results. d Colony areas of mESCs overexpressing DDX10 and NUP98-DDX10 after DDX10 degradation with IAA treatment at different time points in (c). The number of cells for statistical analysis is indicated in the figure. Data are presented as mean values ± SD with the indicated significance from two-sided t-test. Exact p-values are reported in the figure. e Representative SIM images of nucleolar marker proteins Fibrillarin and NPM1 (green) along with HA-tagged proteins (NUP98-DDX10-HA or DDX10-HA) (magenta) in DDX10-AID mESCs expressing NUP98-DDX10 or DDX10. Nuclei stained with Hoechst (blue). Experiments were repeated three times independently with similar results. Scale bar, 2 µm. f Northern blot analysis of pre-rRNA intermediates in DDX10-AID (+ OsTir1) mESCs overexpressing NUP98-DDX10 or DDX10, treated with IAA at different time points (0 h, 24 h, and 48 h). MB represents methylene blue staining. Experiments were repeated two times independently with similar results. Source data are provided as a Source Data file.

