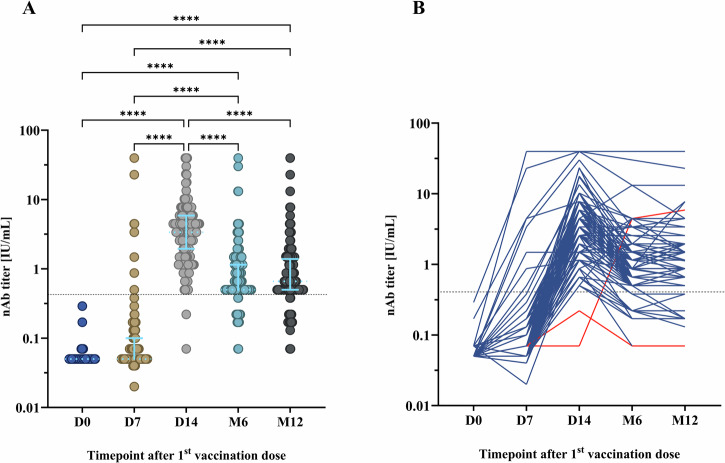
Fig. 2. The development of rabies virus (RABV) neutralizing antibody (nAb) titers at different timepoints after post-exposure prophylaxis (PEP) using the Institut Pasteur du Cambodge (IPC) regimen.
Overall, 148 participants were included for nAb analysis. The fluorescent antibody virus neutralization test (FAVNT) was used to measured RABV nAb titers at baseline (D0), day 7 (D7), day 14 (D14), month 6 (M6), and month 12 (M12) after PEP. A Comparison of RABV nAb titer at various timepoints. Each dot represents a single individual. Light blue lines represent the median and interquartile range. Dashed line indicates the threshold of protective RABV nAb titer at 0.5 international unit per milliliter (IU/mL). Statistics: Friedman test, followed by Dunn’s multiple comparisons test. Asterisks represent significance levels as follows: *p < 0.05, **p < 0.01, ***p < 0.001, and ****p < 0.0001. B Individual evolution of RABV nAb titer. Red lines represent the RABV nAb titer evolution of individuals who did not develop protective threshold at D14. For visualization purposes, data was transformed into logarithmic scales before being used in statistical analysis.

