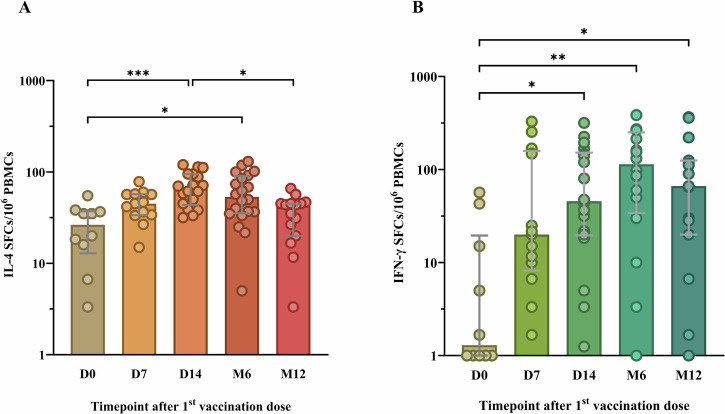
Fig. 3. The development of rabies virus (RABV)-specific interleukin-4 (IL-4) and interferon-gamma (IFN-γ) producing T cells at various timepoints after post-exposure prophylaxis (PEP) using the Institut Pasteur du Cambodge (IPC) regimen.
The fluorospot assay was used to determine IL-4 (A) and IFN-γ (B) secreting cells expressed as spot-forming cells (SFCs) at baseline (D0), day 7 (D7), day 14 (D14), month 6 (M6), and month 12 (M12) after PEP. For visualization purposes, data was transformed into logarithmic scales before being used in statistical analysis. Each dot represents a single individual. Grey lines represent the median and interquartile range. PBMCs, human peripheral blood mononuclear cells. Statistics: Kruskal-Wallis test, followed by Dunn’s multiple comparisons test. Asterisks represent significance levels as follows: *p < 0.05, **p < 0.01, ***p < 0.001, and ****p < 0.0001.

