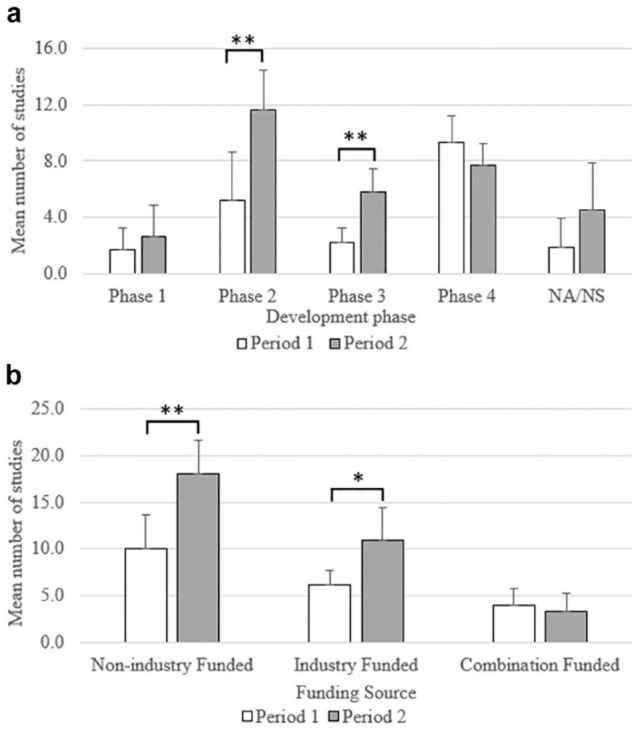
Figure 3.

A comparison of the distribution of clinical studies that included CGM-derived endpoints registered in CT.gov in the period 2012-2017 (P1) versus 2018-2023 (P2) by (a) development phase and (b) funding type. Values represent the mean; error bars represent the standard deviation.
*Two-tailed t test with unequal variances < .05; **two-tailed t test with unequal variances P-value < .01. Abbreviations (NA/NS) not applicable/not specified.
