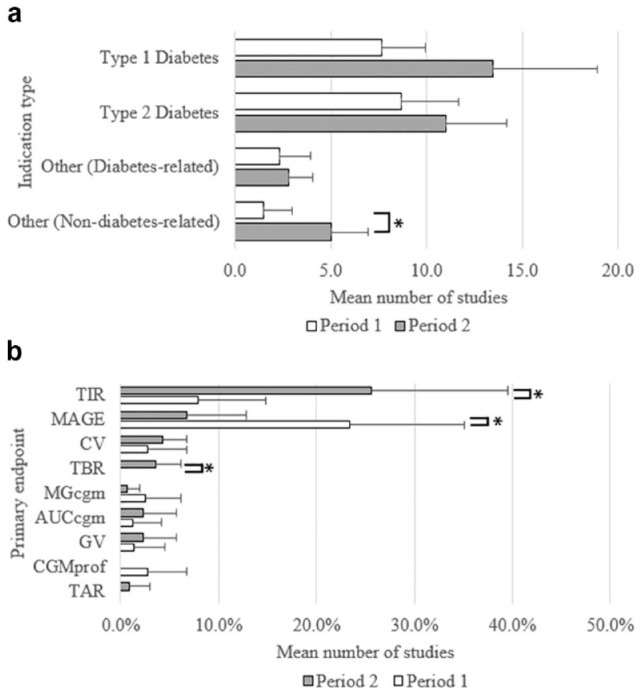
Figure 4.

A comparison of the distribution of clinical studies registered in CT.gov in the period 2012-2017 (P1) versus 2018-2023 (P2) by (a) indication type and (b) CGM primary endpoint (PE) as a proportion of studies all studies in each period that had glycemic PEs. Values represent the mean; error bars represent the standard deviation. *Two-tailed t test with unequal variances < .05. Abbreviations (AUCcgm) CGM area under the curve, (CV) coefficient of variation, (CGMprof) CGM profile, (GV) glycemic variability, (MAGE) mean amplitude of glycemic excursions, (MGcgm) mean glucose determined by CGM, (TAR) time above range, (TBR) time below range, (TIR) time in range.
