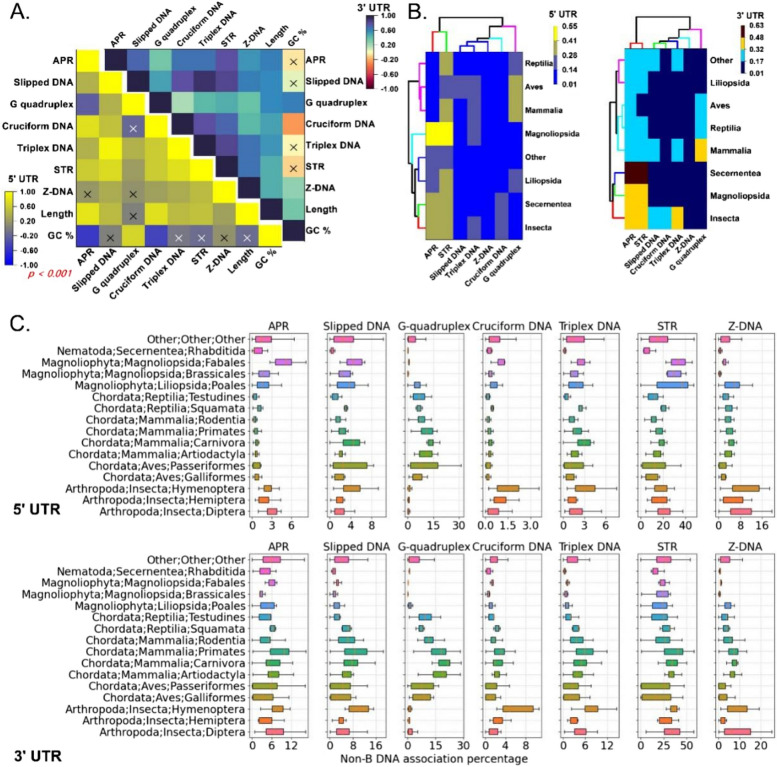
Fig. 1.
Analysis of non-B DNA structures across different UTR regions and taxonomic groups. A Correlation heatmap depicting the correlation between different non-B-DNA structures in the 3′UTR and 5′UTR. The “X” values in the plot indicate that correlation values are not significant (p = 0.001). B Hierarchical clustering of taxonomic groups on the basis of non-B-DNA structures in the 3′UTR and 5′UTR. C Boxplots of association percentages of different non-B-DNA structures in different taxonomic groups

