. 2024 Nov 27;12(11):e009861. doi: 10.1136/jitc-2024-009861

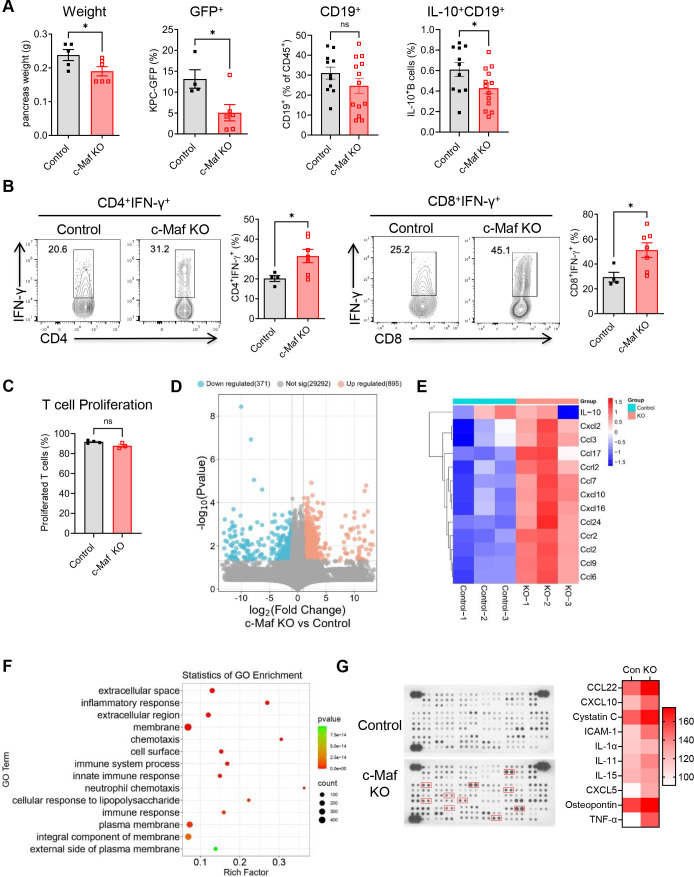
Figure 3. B cell c-Maf deficiency delays tumor progression in the PDAC mouse model. (A) Pancreas weight, percentages of GFP+ tumor cells within CD45 pancreas cells, CD19+ B cells within CD45+ leukocytes, and IL-10-producing B cells of KPC tumor-bearing control and c-Maf KO mice. Each point represents an individual mouse (n=5–13). (B) IFN-γ production by CD4+ and CD8+ T cells after ex vivo restimulation with PMA/Ionomycin. (C) T cell proliferation of OT-II CD4+ T cells after co-culture with FACS-isolated control and c-Maf KO B cells. (D) Volcano plot showing fold change (FC) and p value for the comparison of B cells from control versus c-Maf KO mice based on RNA sequencing data (n=3). (E) Heatmap showing the clustering of chemokines in two groups based on log-relative abundances. (F) GO enrichment analysis of genes defining the 14 most significant terms. (G) Cytokine/chemokine array of culture supernatants of isolated B cells (pooled samples from three control and KO mice). The mean pixel intensity of differentially expressed molecules was measured using ImageJ software. *p<0.05; ns, not significant. FACS, fluorescence-activated cell sorting; GO, Gene Ontology; IL-10, interleukin 10; KO, knockout; PDAC, pancreatic ductal adenocarcinoma; PMA, phorbol 12-myristate 13-acetate.

Figure 3