. 2024 Nov 27;12(11):e010069. doi: 10.1136/jitc-2024-010069

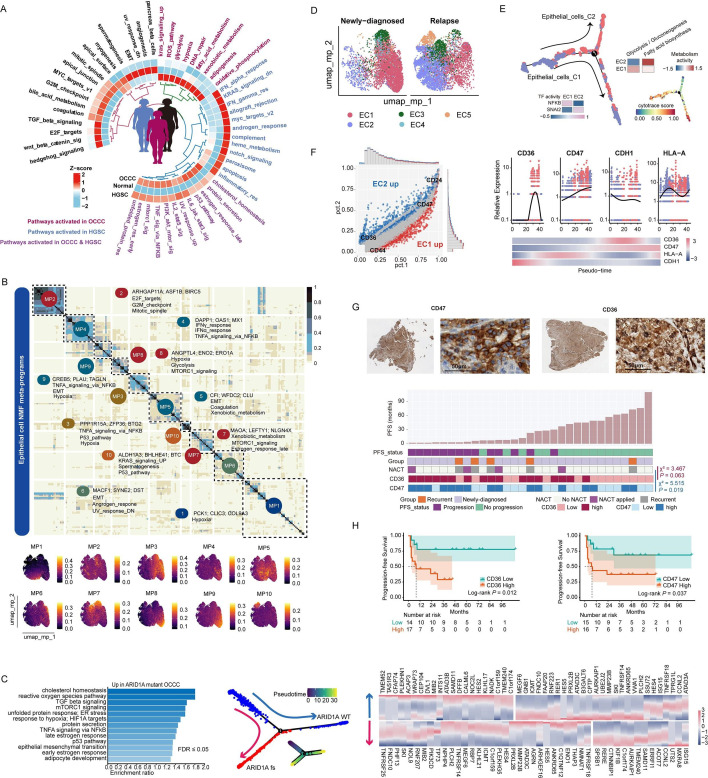
Figure 2. Characteristics and MPs of epithelial cells in OCCC. (A) Heatmap displaying AUCell score of Hallmark pathways across different pathologies (OCCC scRNA-seq cohort: n=5, this article; HGSC scRNA-seq cohort, n=7, GSE184880; normal ovary scRNA-seq cohort, n=5, GSE184880). (B) Heatmap and feature plot showing 10 MPs of OCCC epithelial cells extracted by NMF method. (C) Pathway activity (left), evolutionary trajectory (middle) and trajectory-related gene expression (left) of ARID1A MUT OCCC epithelial cells (two patients) compared with ARID1A WT cells (two patients) in FFPE cohort. (D) UMAP plot showing five subclusters of 11 448 epithelial cells in OCCC scRNA-seq cohort, and differential distribution in newly diagnosed (n=2) and recurrent OCCC (n=3). (E) Pseudo-time analysis by monocle2 and cell stemness scoring by CytoTRACE in OCCC scRNA-seq cohort uncovered an epithelial cell evolution trajectory from EC1 to EC2. Heatmap showing transcriptional factor and metabolic pathway activity between the two subpopulations. (F) Left: differential gene expression between EC2 and EC1. Right: upregulation of CD36 and CD47 while downregulation of CDH1 and HLA-A throughout the epithelial evolutionary trajectory. (G) Representative IHC staining of CD36 and CD47 in OCCC tumors (left: whole slide, right: high power field, 400×), and correlations (Pearson χ2 analysis) between CD36 and CD47 expression levels in OCCC IHC cohort (n=31) and presampling NACT. (H) urvival analysis of CD36 and CD47 expression level in OCCC IHC cohort (n=31, outcome: PFS, logrank test). FFPE, formalin-fixed paraffin-embedded; HGSC, high-grade serous cancer; IHC, immunohistochemistry; NACT, neo-adjuvant chemotherapy; NMF, non-negative matrix factorization; OCCC, ovarian clear cell carcinoma; UMAP, Uniform Manifold Approximation and Projection.

Figure 2