. 2024 Nov 27;12(11):e010069. doi: 10.1136/jitc-2024-010069

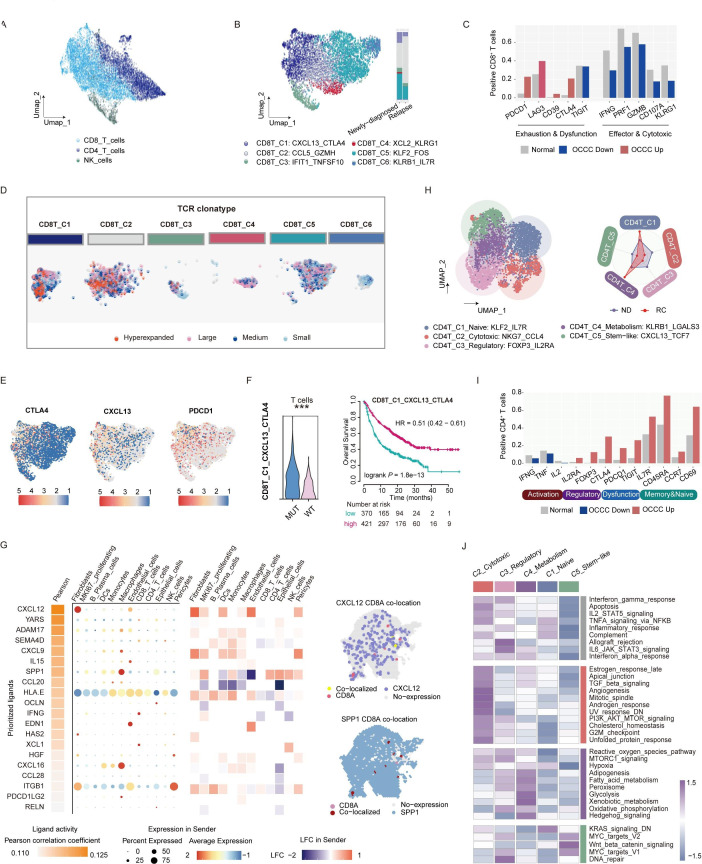
Figure 3. T cell phenotypes and neoantigen-reactive subsets in OCCC. (A) UMAP plot of 12 215 T cells (6554 CD8+ T cells, 4746 CD4+ T cells, and 915 NK cells) in OCCC scRNA-seq cohort (n=5). (B) Subclustering of CD8+ T cells in OCCC scRNA-seq cohort, and differential distribution in newly diagnosed (n=2) and recurrent OCCC (n=3). (C) Comparisons of the proportion of marker gene positive cells of CD8+ T cluster between OCCC and normal ovary (OCCC scRNA-seq cohort: n=5, this article; normal ovary scRNA-seq cohort, n=5, GSE184880). (D) Three of the five fresh OCCC tumors (OCCC-3, OCCC-4, OCCC-5) underwent scTCR-seq. Dimplot featuring TCR clonotypes (determined by scRepertoire R package) of CD8+ T subclusters. Categories of TCR clonotype were determined by the frequency of a certain TCR clonotype among whole T cell population. Hyperexpanded: beyond 10%; large: 1%–10%; medium: 0.1%–1%; small: 0.001%–0.01%. (E) FeaturePlot marking CTLA4, CXCL13, and PDCD1 expression in CD8+ T cells. (F) Left: comparison of CD8_C1_CXCL13_CTLA4 signature UCell score of T cells between ARID1A MUT and WT OCCCs (Wilcoxon test). Right: survival curves showing correlation between CD8_C1_CXCL13_CTLA4 signature score and overall survival of pan-cancer patients receiving immunotherapy (log-rank test). (G) Ligand–receptor activity inferred by Nichenet predicted potential regulatory networks of CD8+T cells. (H) Subclustering of CD4+ T cells in OCCC scRNA-seq cohort (n=5). (I) Comparisons of essential gene expression frequency in CD4+ T cells between OCCC and normal ovary (OCCC scRNA-seq cohort: n=5, this article; normal ovary scRNA-seq cohort, n=5, GSE184880). (J) Hallmark pathway activity of CD4+ T cells subclusters in OCCC scRNA-seq cohort (n=5). MUT, mutant; OCCC, ovarian clear cell carcinoma; UMAP, Uniform Manifold Approximation and Projection; WT, wildtype.

Figure 3