. 2024 Nov 27;12(11):e010069. doi: 10.1136/jitc-2024-010069

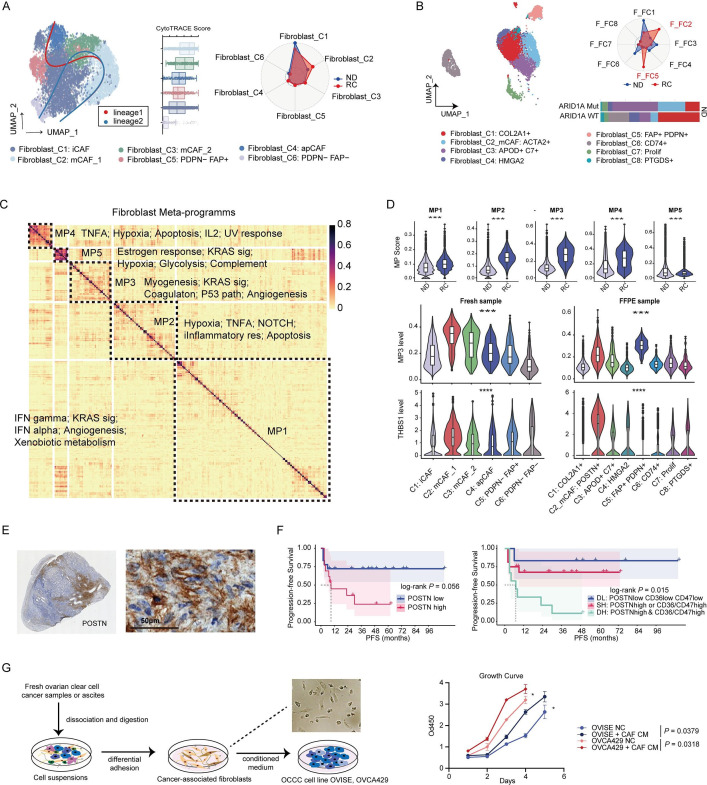
Figure 4. Characteristics and MPs of fibroblasts in OCCC. (A) UMAP plot of 7736 fibroblasts identified in OCCC fresh tumors by scRNA-seq (left, n=5). Radar plot showing proportions of fibroblasts subpopulation in newly diagnosed (n=2) and recurrent OCCC (n=3) (right). (B) UMAP plot of fibroblasts in OCCC FFPE samples by scFFPE-seq (left, n=8). Radar plot showing proportions of fibroblasts subpopulation in newly-diagnosed (n=4) and recurrent OCCC (n=4) (right top). Barplot showing proportions of fibroblasts subpopulation in ARID1A mutant (n=2) and wildtype (n=2) OCCC. (C) Heatmap showing five MPs of OCCC fibroblasts (n=13) extracted by NMF method. (D) Top: violin plot of MPs activity between fibroblasts from ND and RC tumors (Wilcoxon test, ***p<0.001). Middle and bottom: violin plots of MP3 activity and THBS1 expression level across fibroblasts subsets (Kruskal-Wallis test, ***p<0.001). (E) Representative IHC staining of POSTN in OCCC tumor, left: whole slide, right: high power field, 400×. (F) Survival curves of POSTN expression level in IHC cohort. Outcome: PFS, log-rank test. DL: double low expression of neither tumor marker nor stroma marker (POSTN low CD36 low CD47 low); SH: single high expression of either tumor marker or stroma marker (POSTN high CD36 low CD47 low or POSTN low CD36 high CD47 low or POSTN low CD36 low CD47 high); DH: double high expression of both tumor marker and stroma marker (POSTN high CD36 high CD47 high or POSTN high CD36 high CD47 low or POSTN high CD36 low CD47 high). (G) Scheme of cancer-associated fibroblasts isolation and coculture with tumor cells (left). Growth curve showed that supernatant of fibroblasts culturing medium promoted ovarian tumor proliferation (right, t-test, *p<0.05). FFPE, formalin fixed paraffin-embedded; IHC, immunohistochemistry; MPs, metaprograms; ND, newly diagnosed; OCCC, ovarian clear cell carcinoma; PFS, progression-free survival; RC, recurrent; UMAP, Uniform Manifold Approximation and Projection.

Figure 4