. 2024 Nov 27;12(11):e010069. doi: 10.1136/jitc-2024-010069

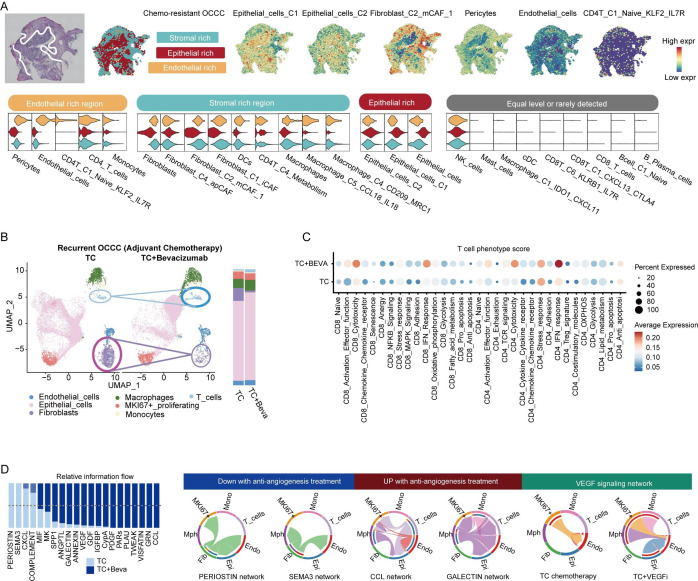
Figure 5. VEGF inhibition reinvigorates T cell function. (A) Spatial characterization of OCCC sample. Feature plots and violin plots showing distribution of lineage signature score (calculated by UCell method) in different niches (epithelial-rich, stromal-rich, endothelial-rich and immune-rich). (B) UMAP plot and bar plot showing cell composition of recurrent OCCC with or without adjuvant bevacizumab treatment. (C) Dot plot of T cell phenotype score between patients receiving TC (Taxol plus carboplatin) chemotherapy and TC+BEVA (bevacizumab) adjuvant regimen. (D) Barplot of relative cell-cell communication network activity between TC and TC+BEVA subgroup patients with OCCC. OCCC, ovarian clear cell carcinoma; UMAP, Uniform Manifold Approximation and Projection.

Figure 5