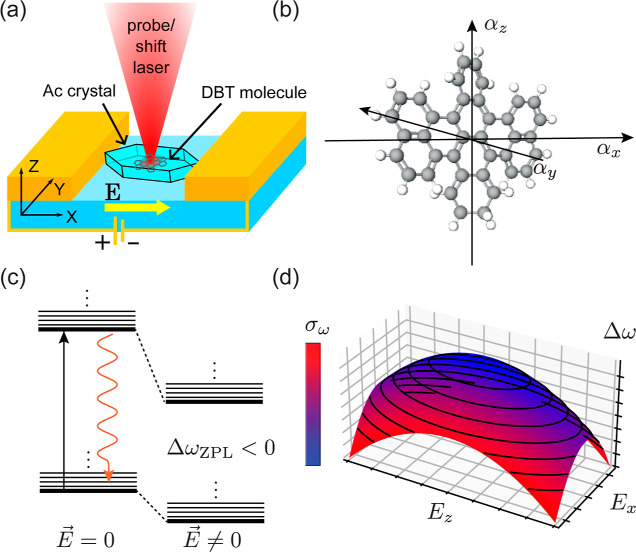
Figure 1.
(a) Sketch of the studied sample. DBT-doped nanocrystals are dispersed on a glass substrate, nanostructured with 4 μm gap interdigitated gold electrodes. The applied voltage can be scanned in a [−100:+100] V range, producing an electric field along the x direction. Optical access is available along the z axis and is used in excitation for optical shift and fluorescence collection. (b) Cartoon picture of the DBT molecule, indicating the three symmetry axes corresponding to the diagonal components of the polarizability tensor. (c) Level structure of the ZPL before and after the application of a local electric field. The measurements are performed by resonantly exciting the ZPL and then detecting the Stokes-shifted emitted light due to relaxation through a phononic sideband. (d) Illustrative example of the ZPL frequency shift as a function of the local electric field. The resulting surface is a squeezed paraboloid, narrower along the axis defined by αxx and broader along the axis defined by αzz. The color scale represents the SD experienced by the emitter increasing linearly with the value of the local electric field (Ex, Ez). The contour lines represent the isofrequency curves. From this representation it is clear that it is possible to change SD by moving on an isofrequency line.

