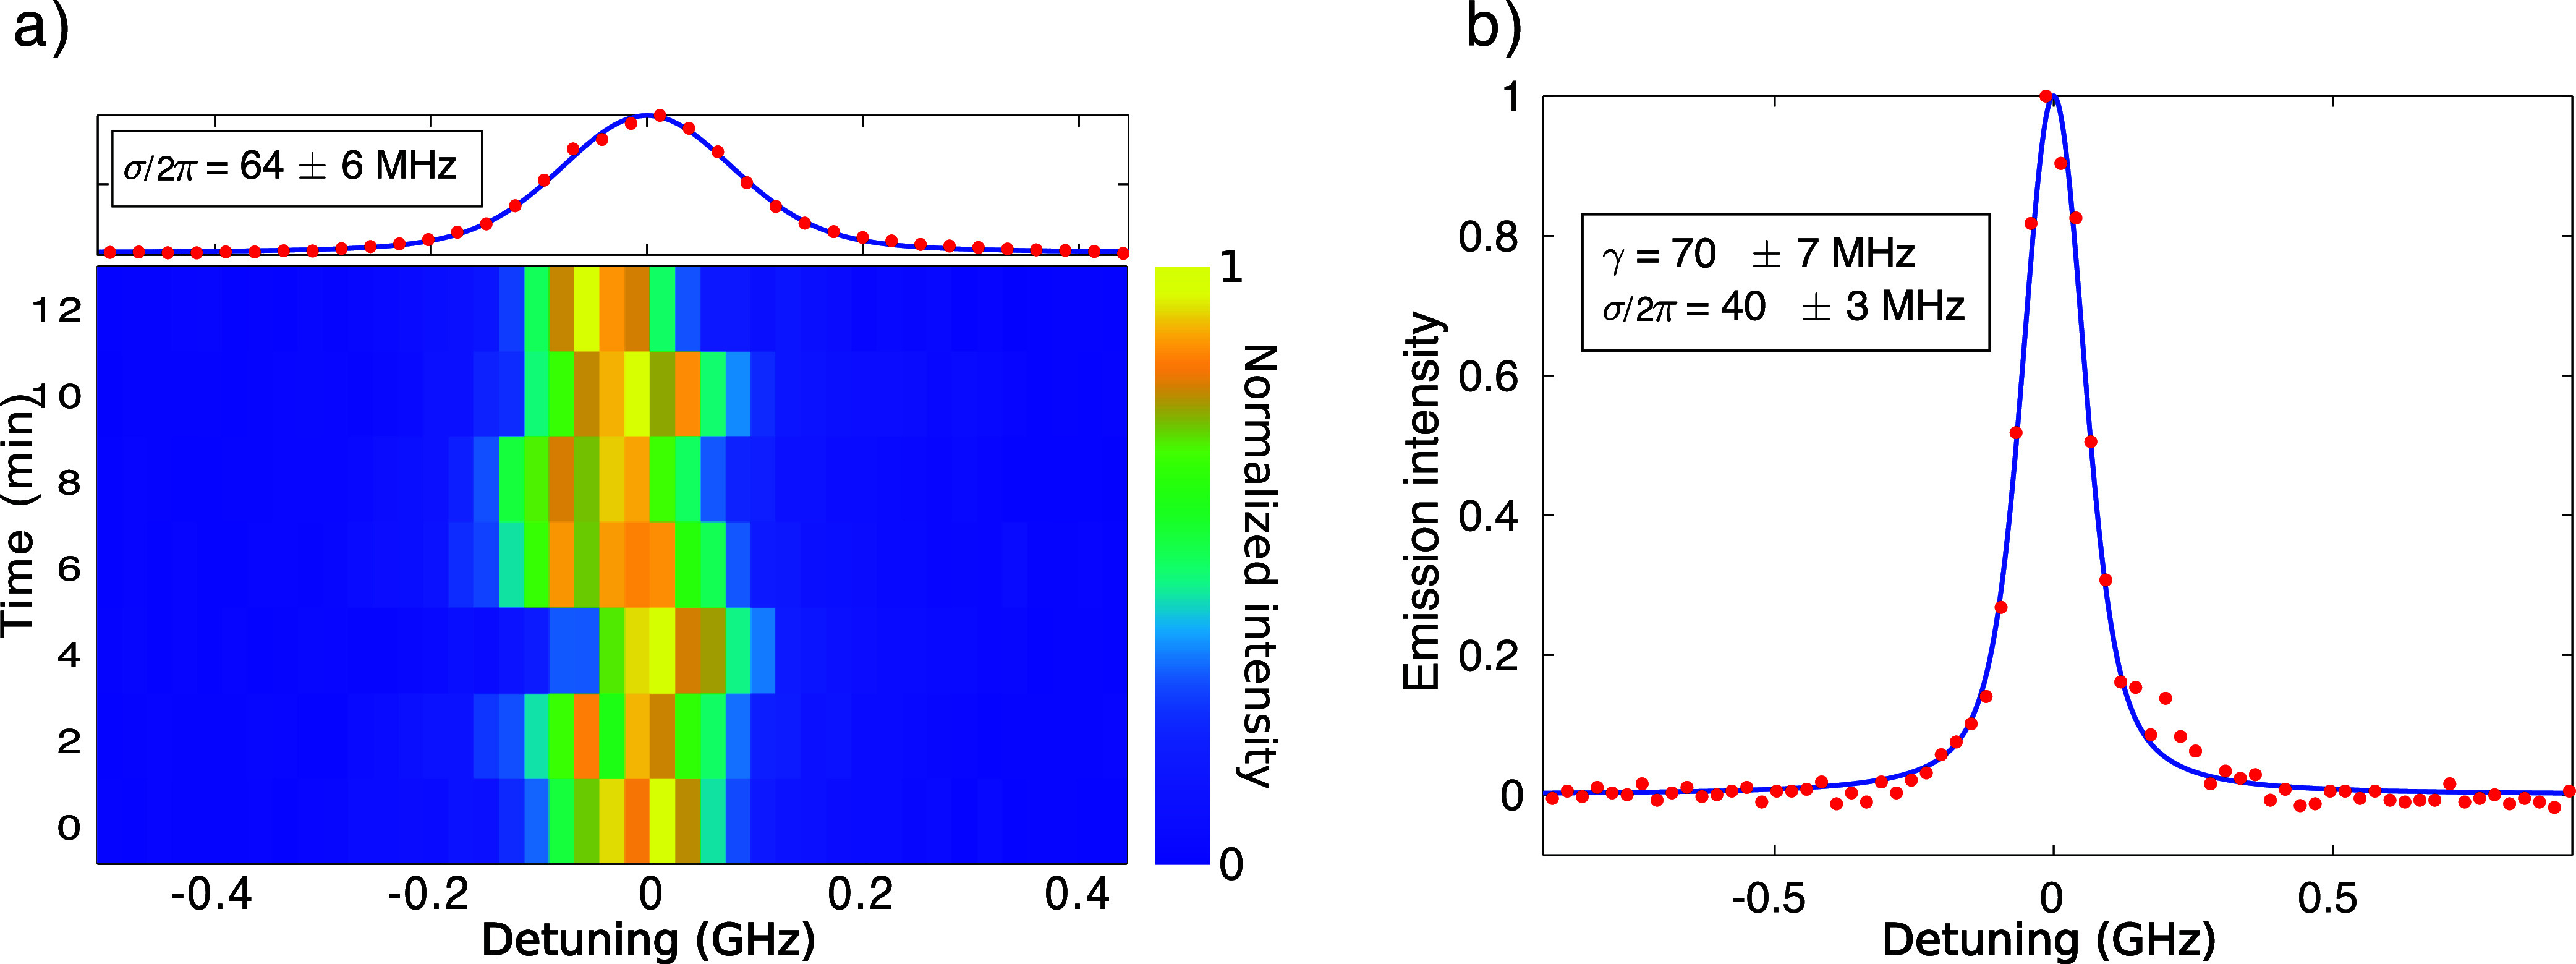
Figure 2.

Excitation spectroscopy and SD. The excitation spectrum from a DBT emitter, obtained by recording the red-shifted fluorescence signal (red dots) as a function of the excitation laser frequency, is fitted by a Voigt profile (blue solid lines). The homogeneous (γ) and the inhomogeneous (σ) broadening components can be extracted from the fits. Here, each overall swipe is obtained at a scan speed of 0.5 GHz/s. (a) Each line corresponds to an excitation spectrum plotted in color scale. The total measurement time for the repeated swipes amounts to 12 min. The integrated signal is plotted in the top panel. (b) A single snapshot is shown where the lower σ component confirms that the SD depends on the observation time.
