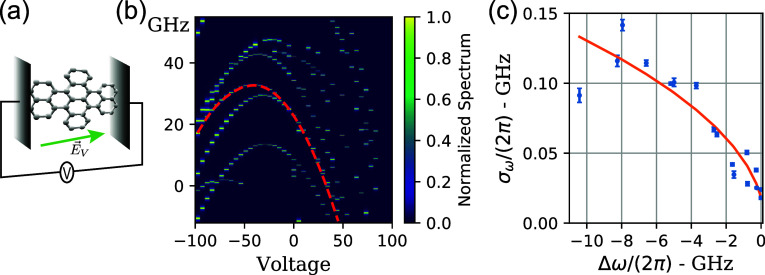
Figure 3.
Stark shift and SD (a) cartoon picture of the specific configuration. We perform the spectral measurements on a DBT molecule embedded between two electrodes at fixed voltage difference generating a tunable in-plane electric field in the direction of the principal polarization axis defined by αxx. (b) Typical measurement of the excitation spectra (color coded along the y axis of the figure) as a function of the applied voltage on the electrodes. Each parabola can be associated with a different molecule. The measurements are obtained with a scan speed of 0.5 GHz/s. At this scanning speed the observed line is broadened by the fast components of SD. (c) Measured SD as a function of the frequency shift extracted from the data highlighted by the red dashed line in (b); the values of σω are extracted by fitting each fixed voltage spectrum with a Voigt profile. The orange line corresponds to the best fit of the square-root dependence of SD against the shift predicted in eq 3.

