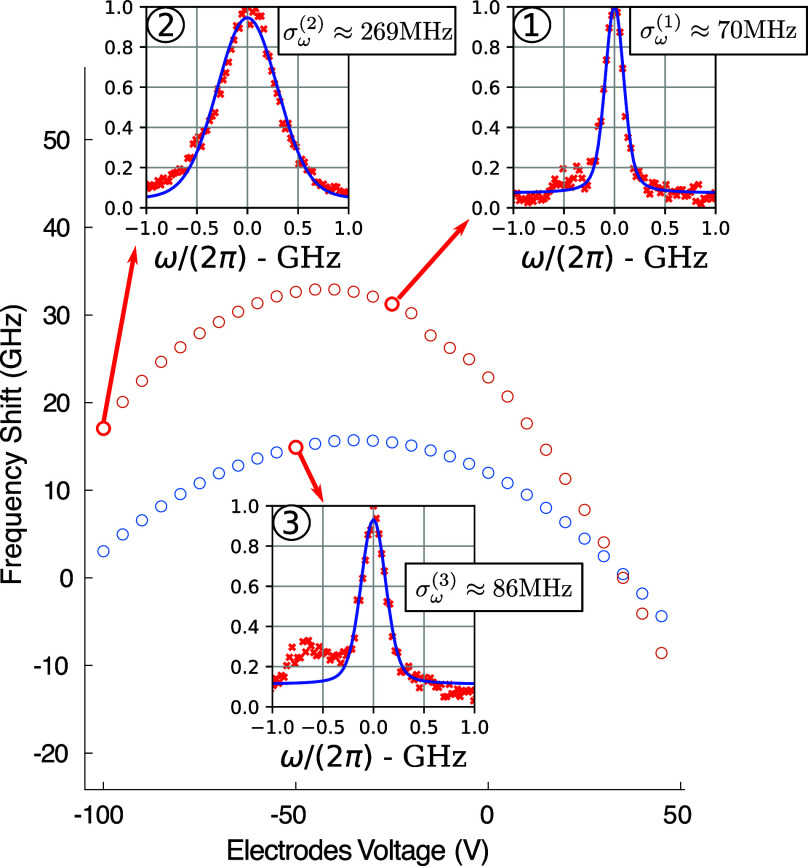
Figure 5.
Effect of electric field control on SD. The parabolas are obtained by monitoring the frequency of emission of a molecule during a scan over the electrode voltage. The orange dots are measured before any optical shift while the blue ones after a combined shift that allowed for the creation of a local field in the z direction. In correspondence to the red highlighted points, we measured SD by repeating excitation spectroscopy measurements. The integrated signal is presented in the insets. A Voigt profile fit on each of the integrated signals allowed for the isolation of the Gaussian component of the broadening associated with SD.

