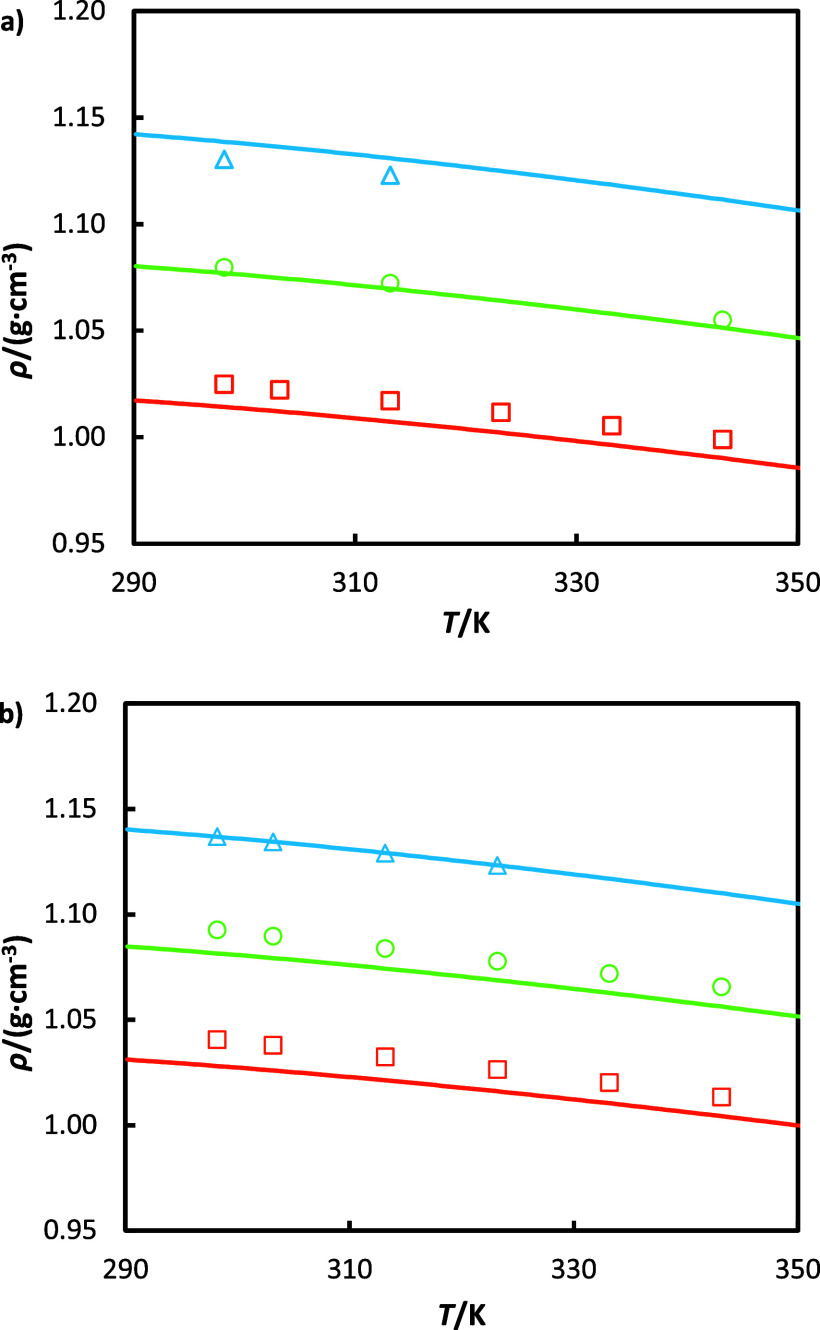
Figure 4.
Densities ρ as a function of temperature T for aqueous solutions containing (a) 28 mass % MEA and 7% HEIA and (b) 26 mass % MEA and 14% HEIA, respectively, and with different CO2 loadings α0. This work: (a) orange □, α = 0; green ○, α = 0.275; blue Δ, α = 0.55; (b) orange □, α = 0; green ○, α = 0.23; blue Δ, α = 0.47; and — correspond to the predictions using the Modified Weiland model with parameters from Table 11.

